
EB Daily Market Report - Wednesday, April 16, 2025
Executive Summary
- Futures were lower overnight and our major indices gapped down
- From the opening gap lower, our major indices mostly held on until 1:30pm ET, at which time Fed Chief Powell (ie, Mr. Kiss o' Death) spoke in Chicago
- Powell's remarks were very similar to recent speeches, saying that they're not quite sure which of their two mandates to attack first
- Much more selling followed those comments for the next two hours, where we've seen buyers step back in
- Nearly all of those "after 1:30pm" losses have been recouped in yet another sign of manipulation by market makers
- Technology (XLK, -3.66%) was the biggest culprit of intraday selling, though the XLK is now 1.6% off its earlier low
- NVIDIA Corp (NVDA, -7.58%) led semiconductors ($DJUSSC, -5.89%) much lower throughout the day, but is now back near its opening price - further manipulation, in my opinion
- Action today is what we should expect with the VIX where it is - up, down, rinse, and repeat
Market Outlook
Yesterday, I asked the question, "Which side will blink first?" I think we now know. The bears have regained control of the short-term action as the 6 days of higher lows are now behind us. The failure at the declining 20-day EMA is more pronounced as selling has escalated. The Volatility Index ($VIX) has responded in kind, jumping nearly 16% to 34.92 at last check at 3:27pm ET. More on volatility below.
Here's a look at the QQQ, the ETF that tracks the NASDAQ 100:
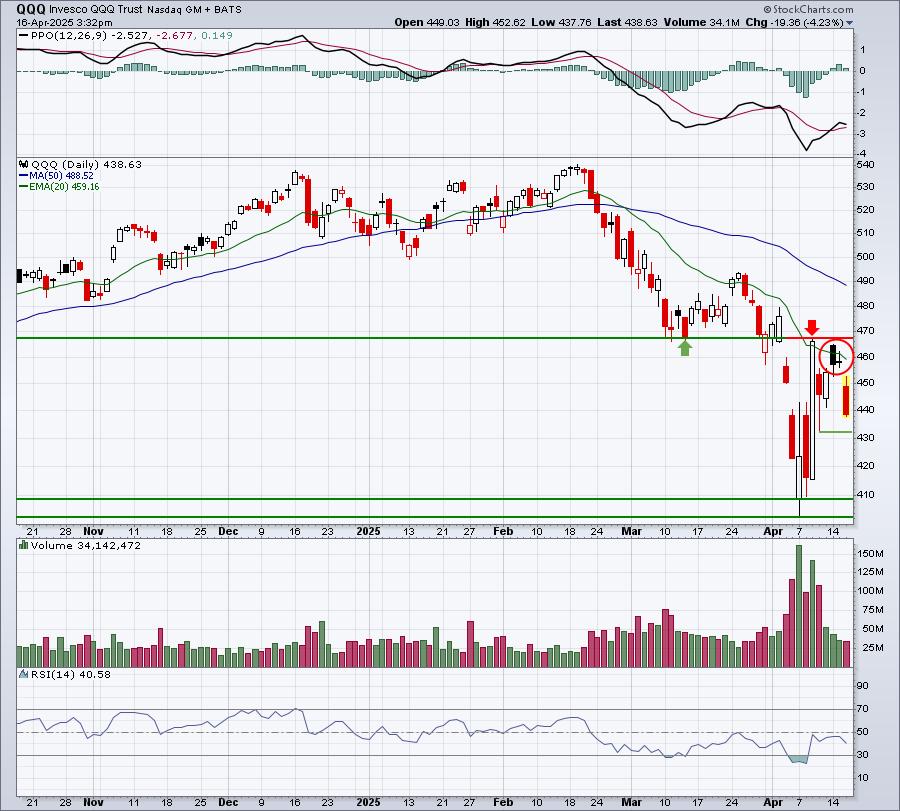
We've looked at a similar chart of the S&P 500. The QQQ is in the same boat. We've seen failures at both key price resistance (red arrow) and the declining 20-day EMA (red circle). Now we're heading lower again, with potential short-term price support at 432 or so, which is the lowest point that the QQQ traded AFTER the 90-day pause in tariffs was announced.
Finally, the ultimate price support is in the 402-408 range. Just like the S&P 500, the QQQ is in a very wide trading range with volatility at extremely high levels. This means that we could see large moves in both directions within this range. The ultimate question is which major price level, support or resistance, breaks first.
Sectors/Industries
To me, when you're in a significant downtrend, highlighted by rapidly-rising fear and panic, sentiment is the key to potential bottoms and future action. I follow the VIX, the equity only put call ratio ($CPCE), and other sentiment metrics to help determine when a bottom forms or is in the process of forming. I believe that process is underway.
After rallies and during subsequent selloffs, I like to compare levels of the VIX. In other words, as new selloffs begin, is the fear beginning to dissipate. If so, that can be a key signal that the bottom has already printed, or if a new bottom is reached, that it's unlikely to continue dropping. This is what happened during the 2008-2009 financial crisis. Take a look:
2007-2009:
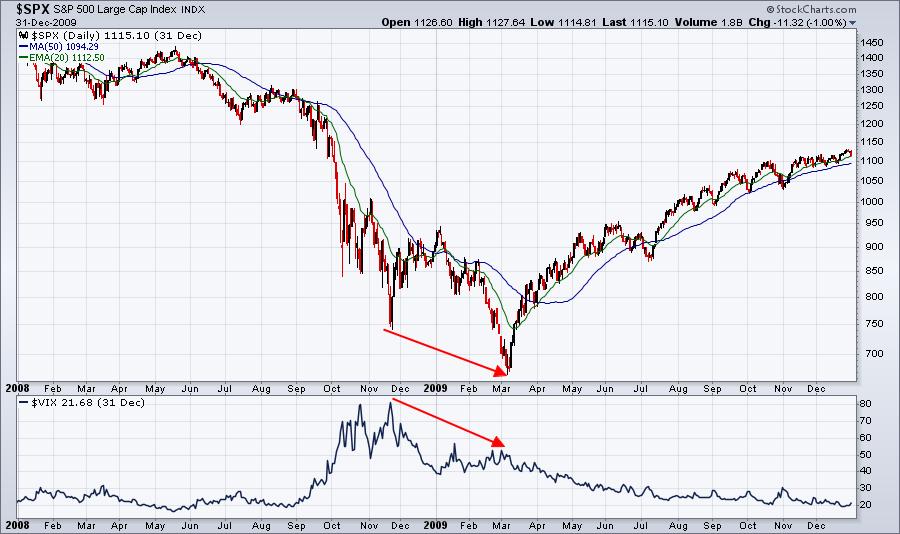
I'm not saying this happens every time, but once you reach an EXTREME pessimistic sentiment reading, it's important to begin looking for a bottom, not more selling.
ChartLists and Trading Strategies
Keeping individual stock trades to a minimum probably remains a solid idea, until we see further improvement in technical conditions.
Upcoming Earnings
Quarterly earnings reports will begin accelerating quite rapidly beginning next week. Two big earnings reports this week that I'll be watching closely will be American Express (AXP) on Thursday morning and Netflix (NFLX) on Thursday afternoon.
Economic Reports
March retail sales: +1.4% (actual) vs. +1.4% (estimate)
March retail sales less autos: +0.5% (actual) vs. +0.3% (estimate)
March industrial production: -0.3% (actual) vs. -0.2% (estimate)
March capacity utilization: 77.8% (actual) vs. 78.0% (estimate)
February business inventories: +0.2% (actual) vs. +0.2% (estimate)
April housing market index: 40 (actual) vs. 38 (estimate)
Happy trading!
Tom