
EB Daily Market Report - Short-Term Caution - Thursday, May 1, 2025
I feel like the short-term risk is turning once again and I'll explain why in my analysis below. Please don't misunderstand. I LOVE what has been happening in terms of manipulation/accumulation and I LOVE the fact that we were able to quickly regain both the 20-day EMA and 50-day SMA on both the S&P 500 and NASDAQ 100.
However, here are the four major indices and where they're at currently on their respective charts and their next key overhead resistance levels:
Dow Jones
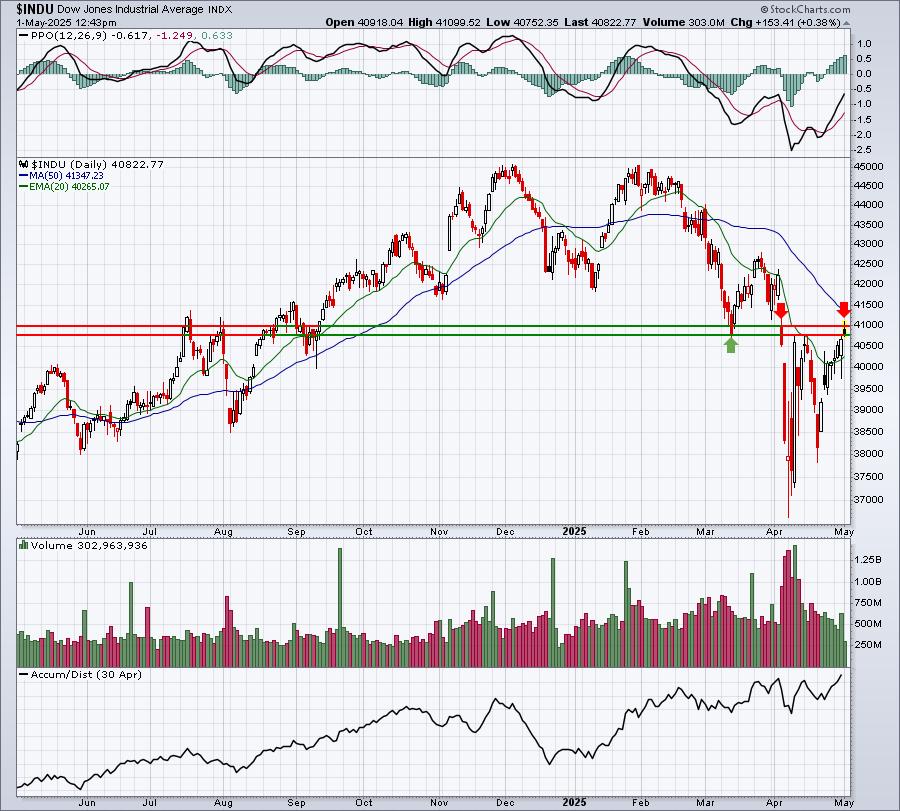
Price resistance here is rather obvious to me.
S&P 500
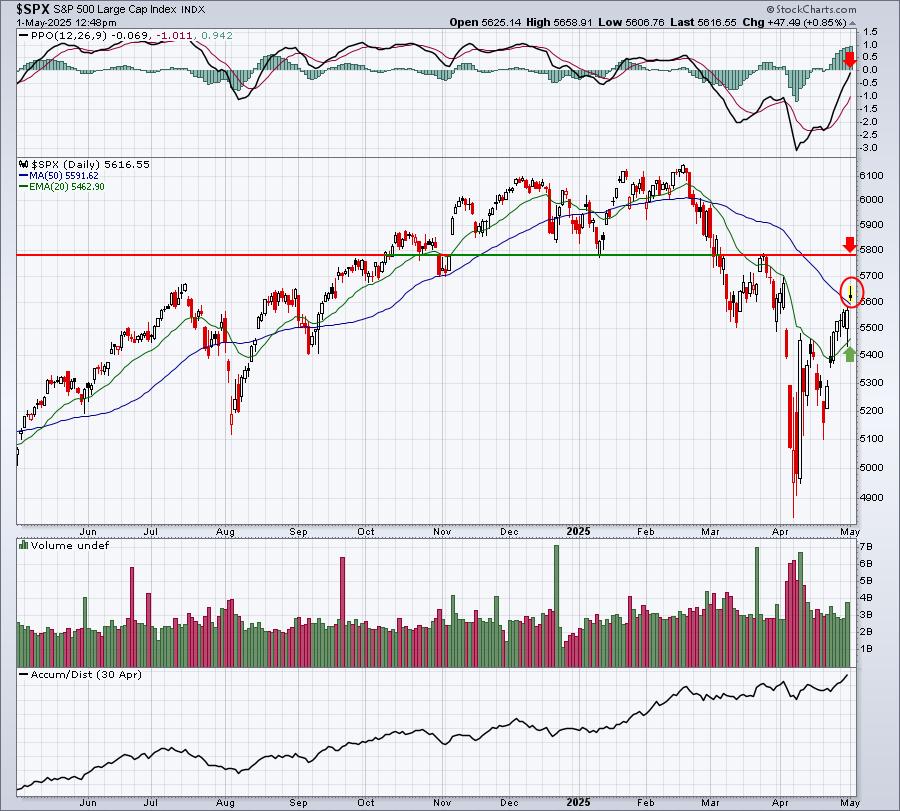
Will this be an island reversal? Can AAPL and AMZN deliver the goods after the bell today (both report quarterly results). What about tomorrow jobs number? Do we get the bearish economic trifecta? Big miss on ADP jobs, negative GDP, AND another miss tomorrow on nonfarm payrolls. If so, do we see another big gap lower, completing the potential island reversal after today's gap higher? Lots of questions.
We do still have room to the upside. Remember the key price resistance at 5782 that we failed to penetrate in late March? It's still there waiting. But at today's high, we were only about 2% away. Given the current rally, the potential upside to that key resistance seems rather small compared to the potential downside if we roll over again.
NASDAQ 100:
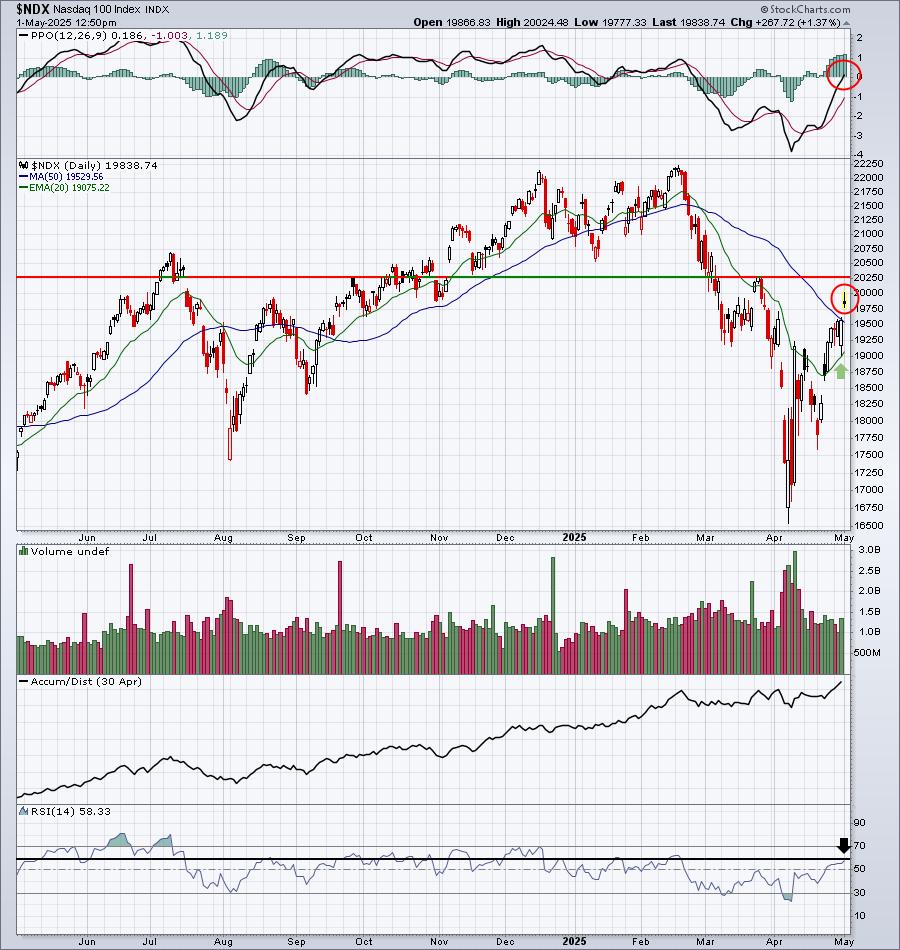
Looks similar to the S&P 500, but I did add the RSI to this chart. During downtrends, RSI 60 tends to be rather big resistance. We see many rallies fail at or near that level. The NDX shows its RSI at 58 right now.
Russell 2000:
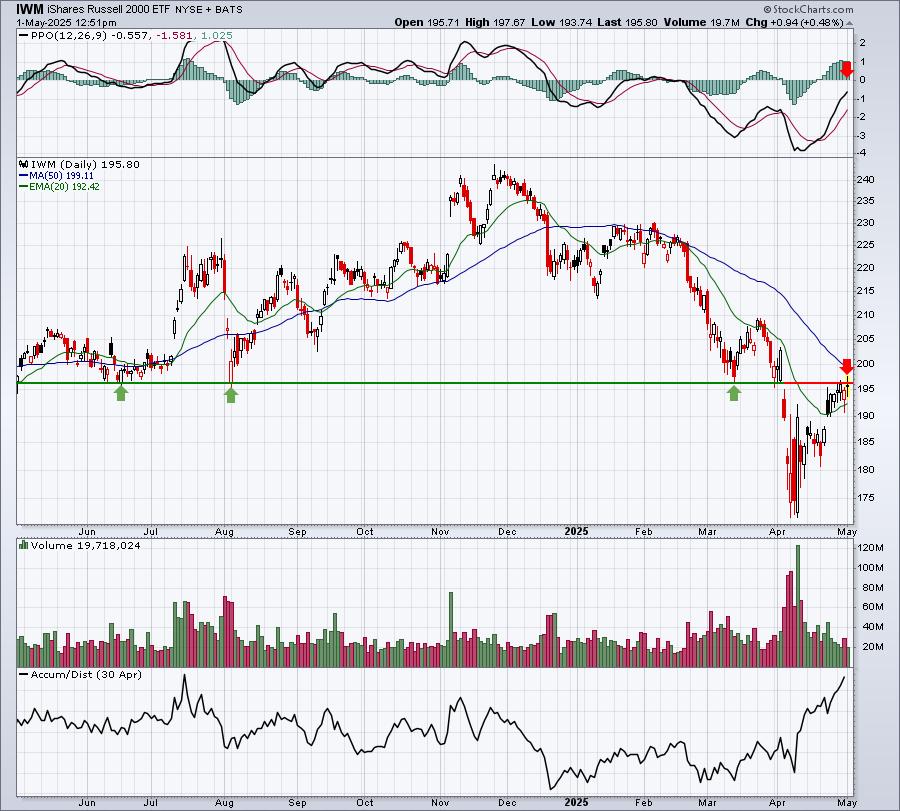
Like the Dow Jones, the IWM's resistance seems very obvious to me. I do absolutely LOVE the sudden accumulation that's taken place in the IWM. I believe that will result in a big move at some point. But are we due for another round of selling first? We'll soon find out.
Sentiment
Check out this 5-day SMA of the equity only put call ratio ($CPCE):
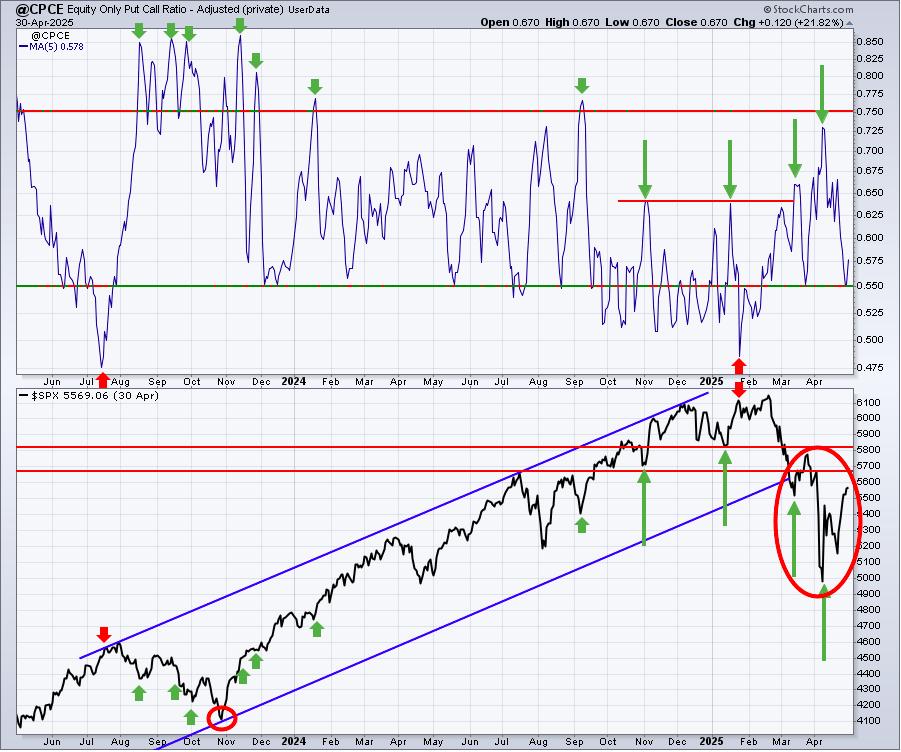
We just hit 0.55, showing the most complacency we've seen in the past 5 weeks or so. Prior moves down to 0.55 have resulted in short-term tops. I thought this was worth pointing out.
Here are a few more INTRADAY ratio charts that I typically show in the Weekly Market Report every Monday. I think it's worth looking at these right now.
QQQ:SPY
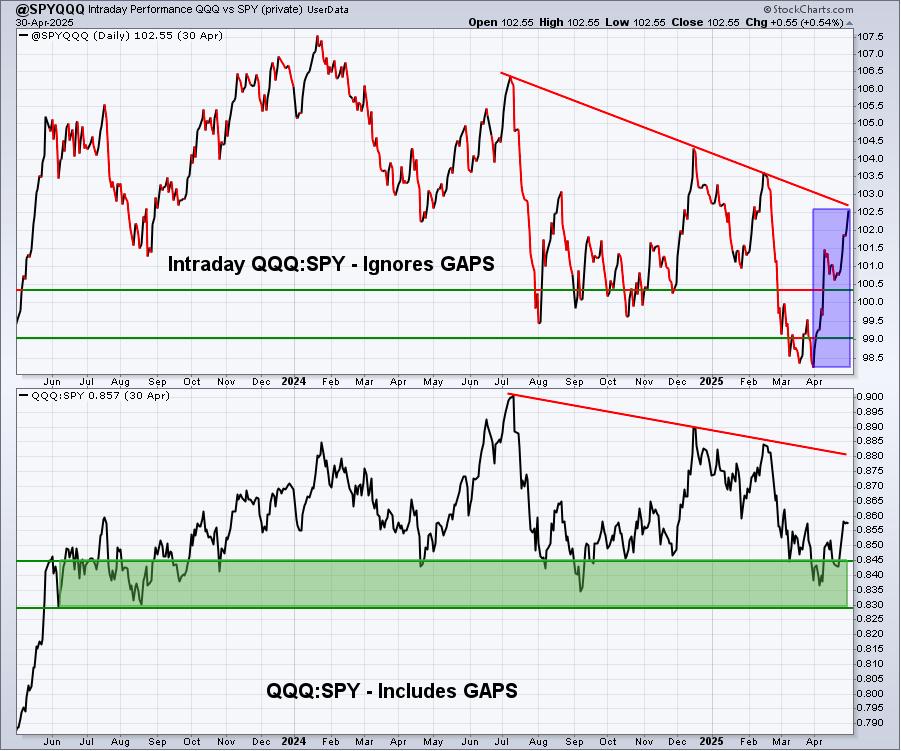
Look at the blue-shaded area. The intraday QQQ:SPY ratio is now up against a lengthy downtrend resistance line. Eventually, I see a breakout, but will it be on this first chance?
XLY:XLP
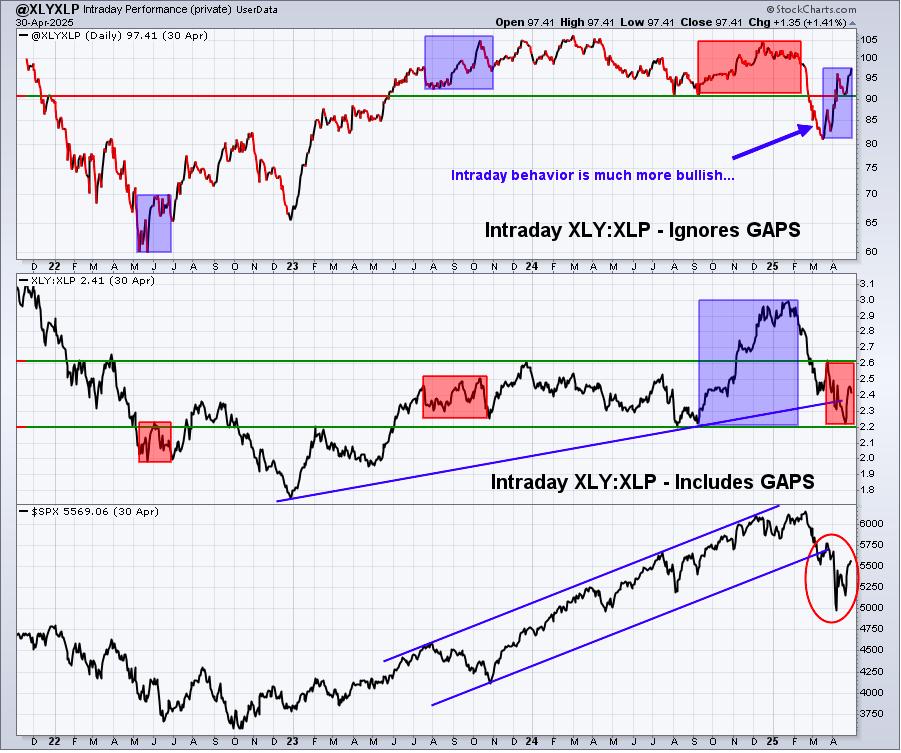
Money continues to rotate BIG TIME to discretionary stocks on an intraday basis, which the latest blue-shaded area reflects. This is another MAJOR bullish development for the longer-term, but I'm only talking short-term here.
IWM:QQQ
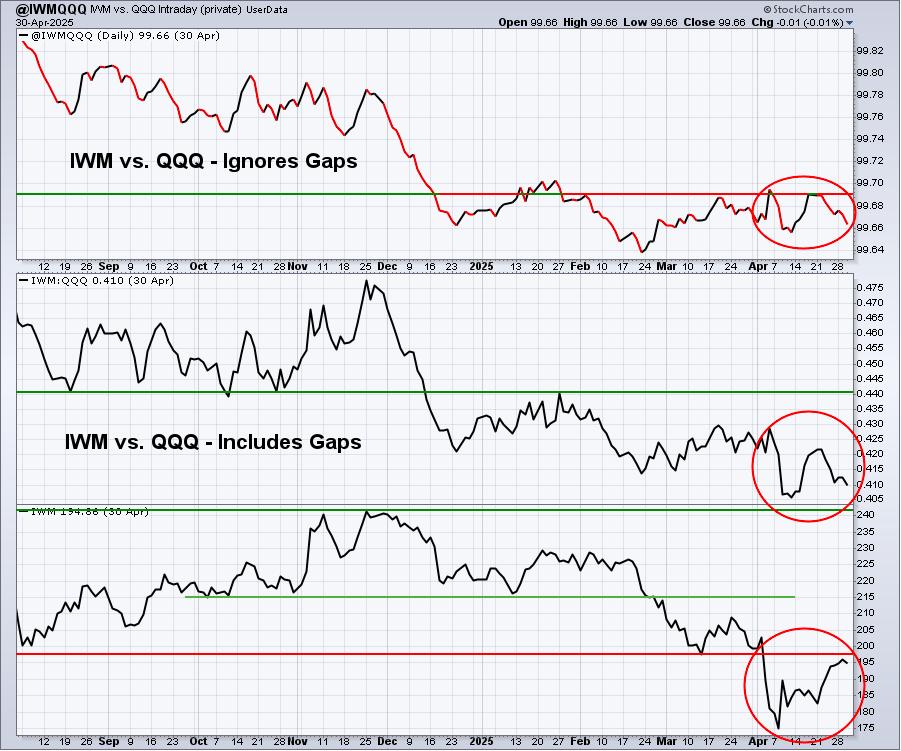
While the IWM itself appears to be under Wall Street accumulation, that accumulation isn't as strong as the QQQ's accumulation, especially on an intraday basis. That's what the red circles in the top 2 panels are telling me.
Conclusion
Listen, I wish I had a crystal ball for every time frame. It's difficult enough to get the long-term direction of the market correct. To get every twist and turn, short-term top and bottom, correct is setting the bar incredibly high, probably unreachable. But I like to talk in terms of risk. I try my best to manage risk. From a long-term buy and hold perspective, I would own stocks. Period. I see the market moving much higher in time and those who use longer-term strategies generally do not want to try and time every up and down in the market. For those of you that fit this category, ignore this Daily Market Report.
From a SHORT-TERM trading perspective, it seems to me like the risk of holding the SPY and QQQ is growing. Sentiment tells us that traders are growing complacent in the near-term. That's a potential problem. Most of our major indices are at or rapidly approaching key price resistance after extended rallies. That's a potential problem. Let's see how we finish today, but if we were to finish close to the today's opening price, we'd have an evening doji star off an uptrend on pretty heavy volume. These evening dojis can mark significant short-term tops. Of course, a strong finish would alleviate any sort of reversing candle. A weak finish today would be problematic, so let's see how we close.
Seasonality could also play a role. Early May (through the 5th) tends to provide historical tailwinds, but the middle part of May (6th through 25th) has a history of being rather challenging. The 5th is Monday, so given everything I've discussed above and knowing that our seasonal window could soon be closing, watch for a potential reversing candle as a sign to think about reducing risk (covered calls, S&P 500 puts for insurance, moving to cash, etc.).
I'm not ready to definitely call a top here, I just want to point out that the SHORT-TERM risks of being long are growing.
Happy trading!
Tom