
EB Daily Market Report - Quick Update - Tuesday, May 13, 2025
May Max Pain
We will be hosting our monthly max pain event later today at 5:00pm ET. After the massive rally we've seen over the past 5 weeks, there is a TON of net in-the-money call premium (over $4 billion on the SPY and QQQ alone) on the table, potentially incentivizing market makers to drive prices lower over the next few days to a week to score a windfall. The fact that there are tons of in-the-money calls does not guarantee lower prices ahead, please remember that. But, in my opinion, it does suggest that the RISK of a market drop has increased.
Please join me at 5:00pm ET today for further discussion on this subject. Room instructions have been sent out in a separate email.
Market Update
Our major indices are mostly higher once again today, though the Dow Jones is an exception. The 2nd heaviest-weighted-component in the Dow is Unitedhealth Group (UNH, -17.84%), which saw its CEO step down and the company withdraw its 2025 guidance. While UNH is clearly the reason behind the Dow's poor performance, it should also be noted that half of the Dow Jones component stocks are lower on today's session. For comparative purposes, 66 of the 100 NASDAQ 100 component stocks are higher, led by Palantir (PLTR, +9.09%), Applovin (APP, +7.21%), and NVIDIA Corp (NVDA, +5.79%). PLTR, in particular, is breaking out to an all-time high today.
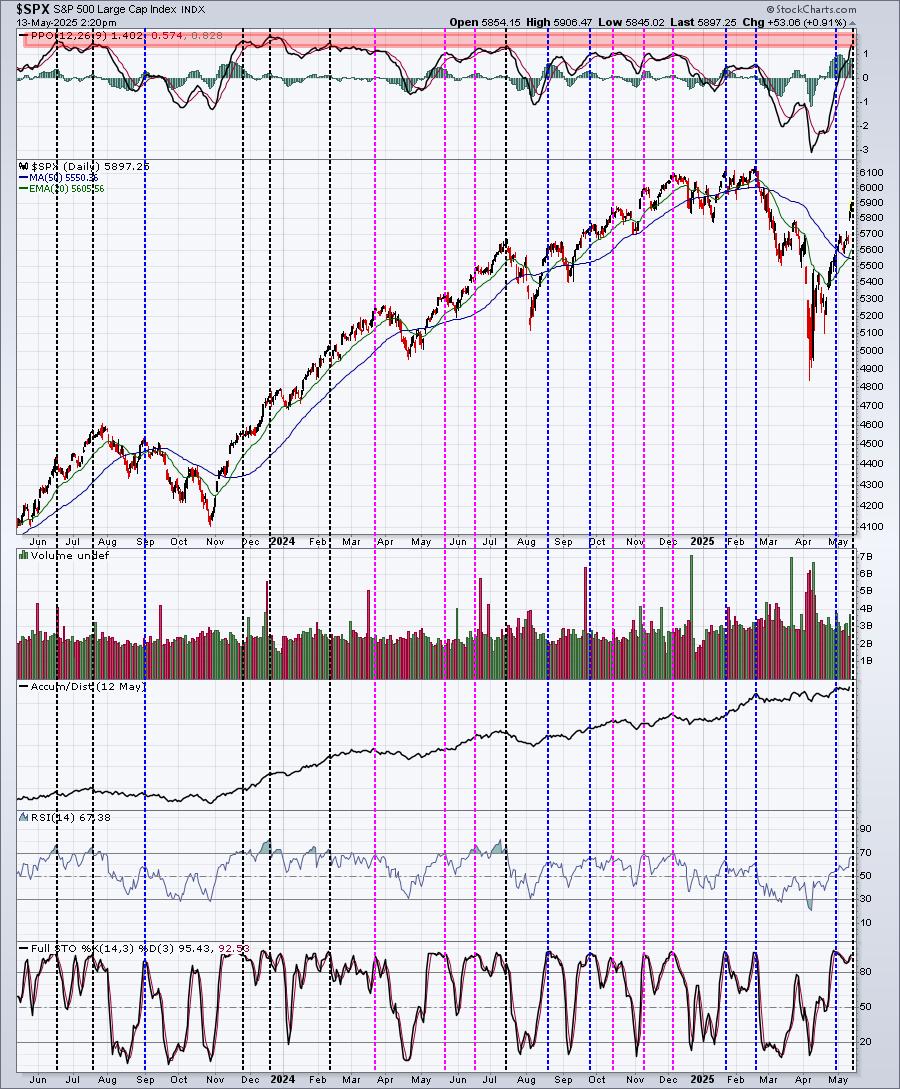
Looking at the S&P 500, it's very easy to illustrate how overbought we are right now. Let's take a look at the S&P 500 chart, which includes both RSI and stochastics, along with the PPO:
A few things here:
The black-dotted vertical lines connect PPOs that have reached between 1.4 and 1.8 over the past two years. If you follow these vertical lines down to price action, you can see that some do intersect with the S&P 500 making a top.
The pink-dotted vertical lines connect RSI 70 levels not previously connected by the black-dotted vertical lines. RSI 70 is widely considered an overbought level among technicians.
The blue-dotted vertical lines connect stochastic readings at or above 90 not previously connected by black-dotted vertical lines and pink-dotted vertical lines. Stochastic readings above 90 are generally viewed as an overbought condition.
While no technical indicator is perfect, if you check out many of the above dotted vertical lines, you'll see that they do tend to mark overbought conditions and, potentially, a short-term reversal to relieve those overbought conditions.
May Gaps Have Been Higher
We have highlighted on many occasions how stocks were manipulated lower at the opening bell as a bottom formed. Institutional buyers, in my opinion, were buying shares hand over fist after strong initial gaps lower. I found the same type of manipulative behavior in June 2022, leading me to call a market bottom then. That turned out to be a solid bottoming call, just like the one from early April.
In May, however, things have changed. For instance, from the April 30th close on the QQQ at 475.47, the QQQ gained 32.38 to close at 507.85 yesterday. But of that 32.38 gain, net opening gaps represented an increase of 29.50. In other words, it appears that Wall Street finished their accumulation phase and now we're seeing gaps to the upside, creating a FOMO (fear of missing out) environment for retail traders, who now must chase these prices to the upside.
There could be a fly in the ointment over the next 3-5 days, though, as May monthly options expire and nearly every in-the-money option contract is a call. Because we've moved straight higher over the past several weeks, there are very few in-the-money puts. That suggests that options traders holding in-the-money call contracts are at considerable short-term risk for a pullback here. It's not imminent, but again the RISK of being long right now (from a short-term trading perspective only) is significant. There are ways to protect recent profits. You can buy S&P puts as a form of insurance to offset any downward movement in that benchmark index. You can also sell calls against any individual stock position you own. It limits your upside potential, but also deflects some of your downside risk.
I want to again be very clear. I am LONG-TERM BULLISH and have been throughout 2025. There were short-term caution signals that I discussed back at MarketVision 2025 in early January and throughout January and the first half of February. We saw those signals evolve into an outright cyclical bear market, which I believe has ended. I do not believe we're going back down to the early-April low. Could we see a 20-day EMA test? Of course. That's a possibility during any bull market rally.
Happy trading!
Tom