
EB Daily Market Report - Tuesday, June 10, 2025
Executive Summary
- Futures were higher this morning, though there was little fundamental news to trade off of
- There were no significant economic reports and very few earnings reports
- The 10-year treasury yield ($TNX) initially fell 4 basis points to 4.44%, but it's since recovered much of that, now down just 1 basis point to 4.47%
- 9 of 11 sectors are higher today as energy (XLE, +1.78%) leads, despite lower crude oil prices ($WTIC, -0.84%) to just below $65 per barrel
- Gold ($GOLD) is flat, but nearly every other commodity is trading bearishly on today's session
- Cryptocurrencies were mostly having a solid day, especially etherium ($ETHUSD, +7.43%)
- Intel (INTC, +8.08%) and Tesla (TSLA, +5.64%) are both rallying today, with the former trying to break out of an 18-month downtrend dating back to late 2023
Market Outlook
The S&P 500 just hit an intraday high of 6043, just 101 points away from its all-time high. Technically, it appears the S&P 500 is on a crash course with that all-time price resistance. Take a look:
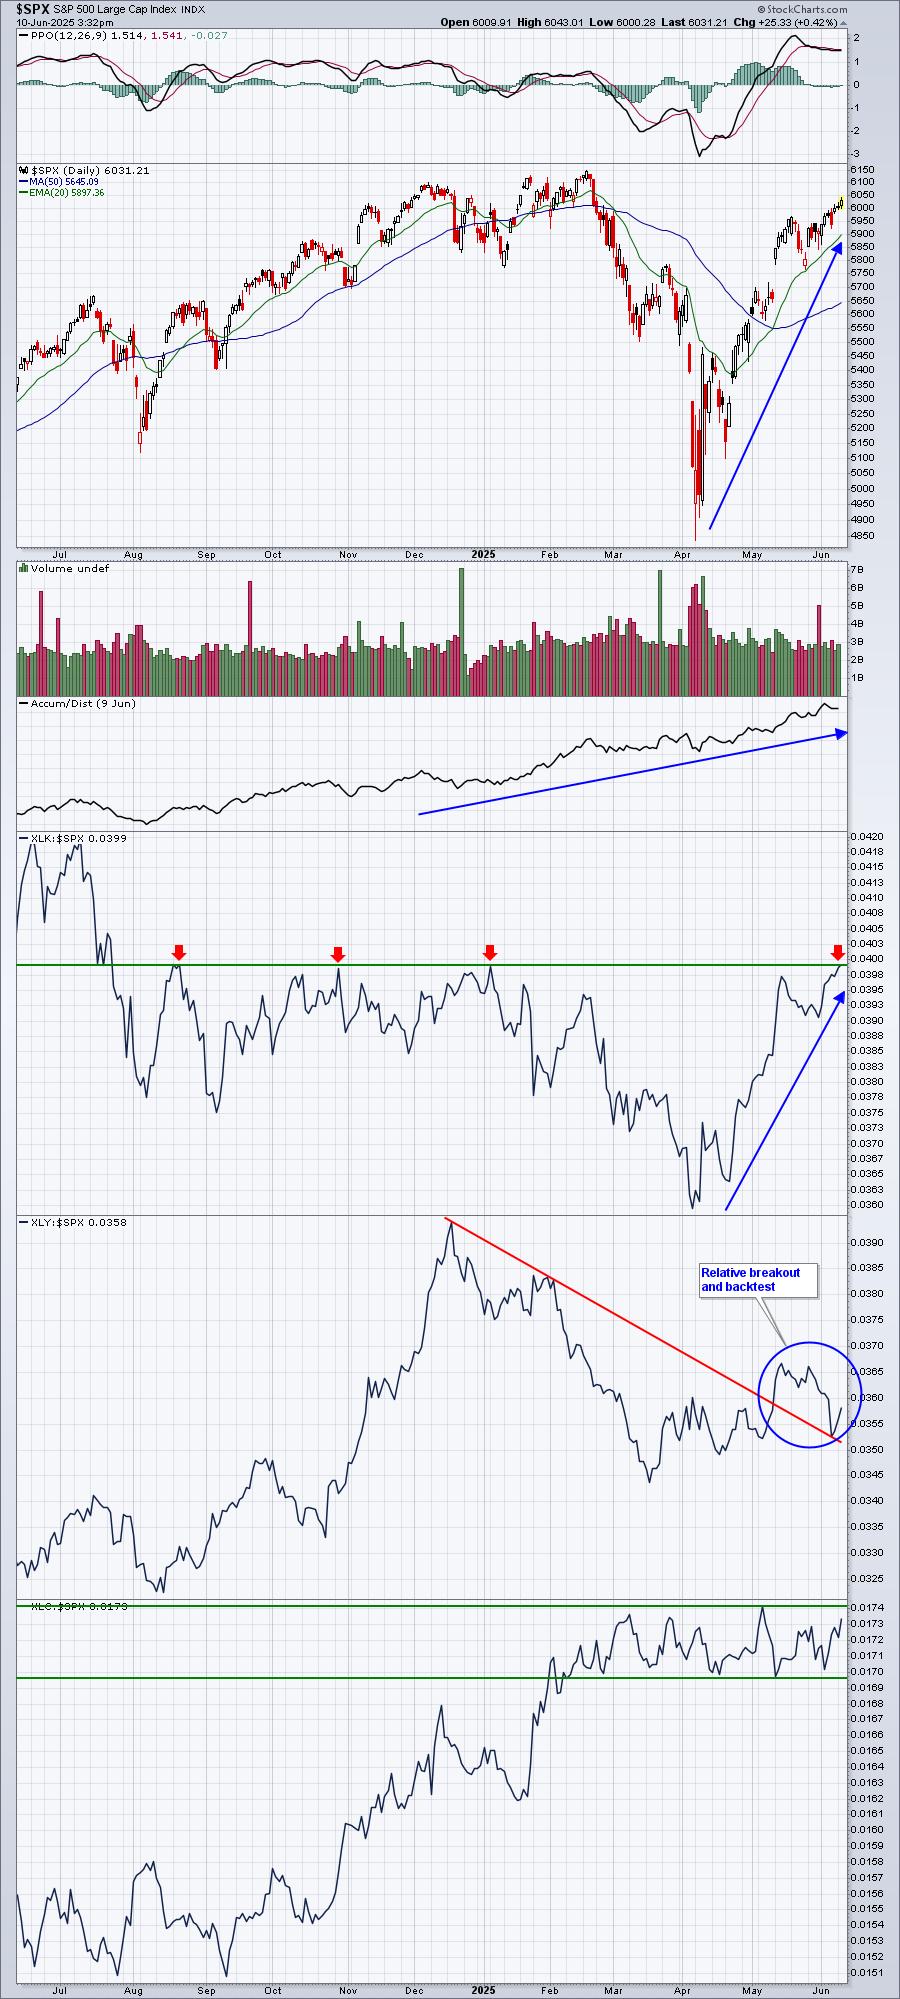
The 3 aggressive sectors have been, for the most part, leading this secular bull market advance off the April 7th low. This represents the makings of a sustainable move to the upside. In other words, outside of possible short-term profit taking, I don't see a big move to the downside coming. We could get some bad news and test the rising 20-day EMA and possibly even the now-rising 50-day SMA, but I would be looking at any such pullback as a serious buying opportunity.
Sectors/Industries
I know there are lots of market folks thinking that gold ($GOLD) continues to perform well, because it remains near its all-time high. But I'd just like to point out that GOLD has slipped considerably on a relative basis to the benchmark S&P 500. The huge decline in the Volatility Index ($VIX) is the likely culprit as it suggests that fear and panic are no longer a part of the current market environment and both are necessary for a bear market (and GOLD) to thrive:
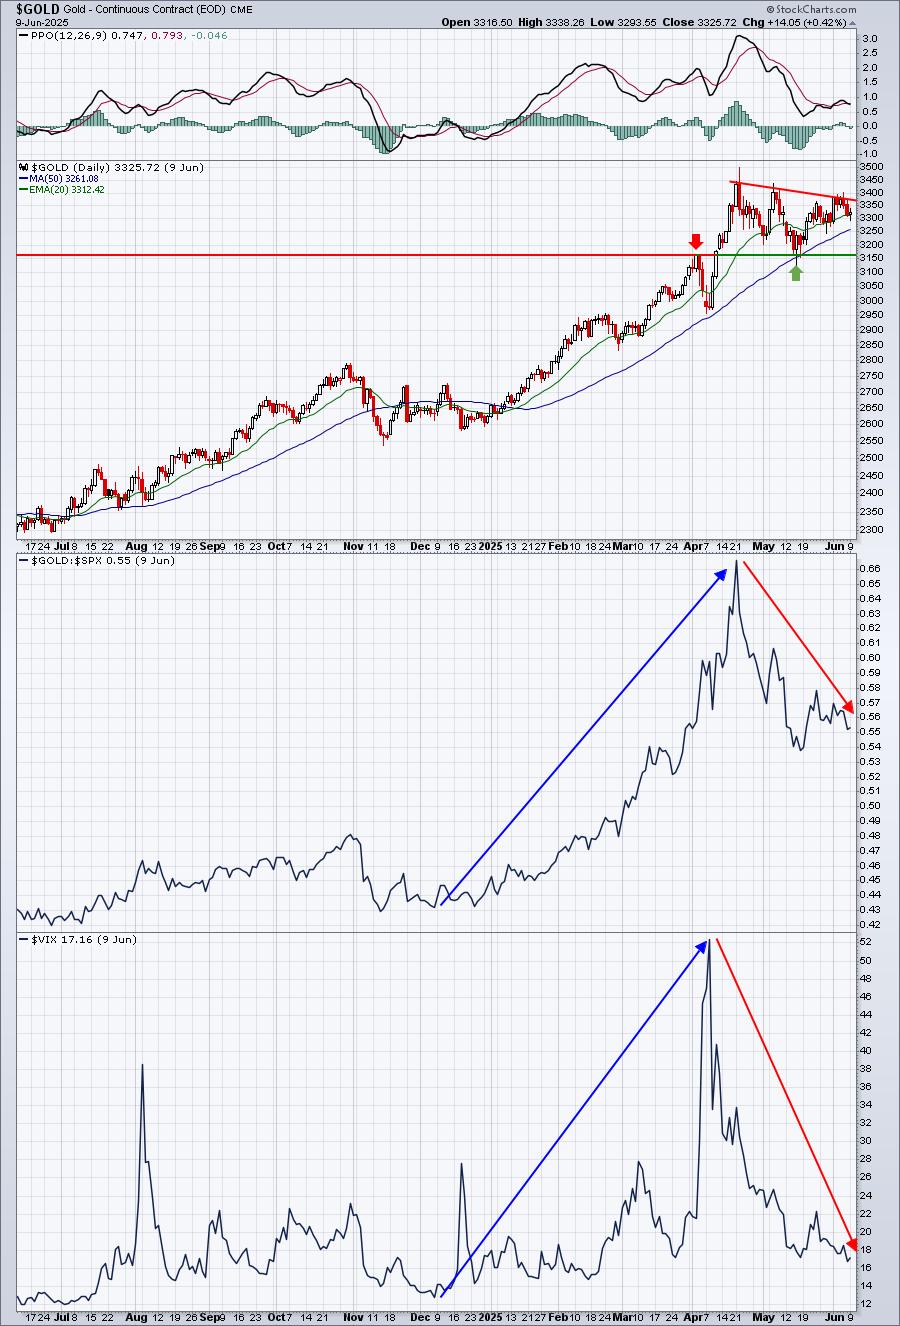
I don't view gold on an absolute basis. It may continue to trade higher. But I'd rather determine the sensibility of a gold investment on its likely performance vs. the benchmark S&P 500. That's where I have issues, because I believe the VIX is heading lower. Historically, a falling VIX is synonymous with underperforming gold.
ChartLists and Trading Strategies
Archer Daniels (ADM) is a stock that we've focused on from a long-term perspective in our Weekly Market Report as the stock had retreated on a monthly chart to a point where its latest long-term breakout occurred. In other words, it was hitting a price level that represented HUGE long-term support. Check it out:
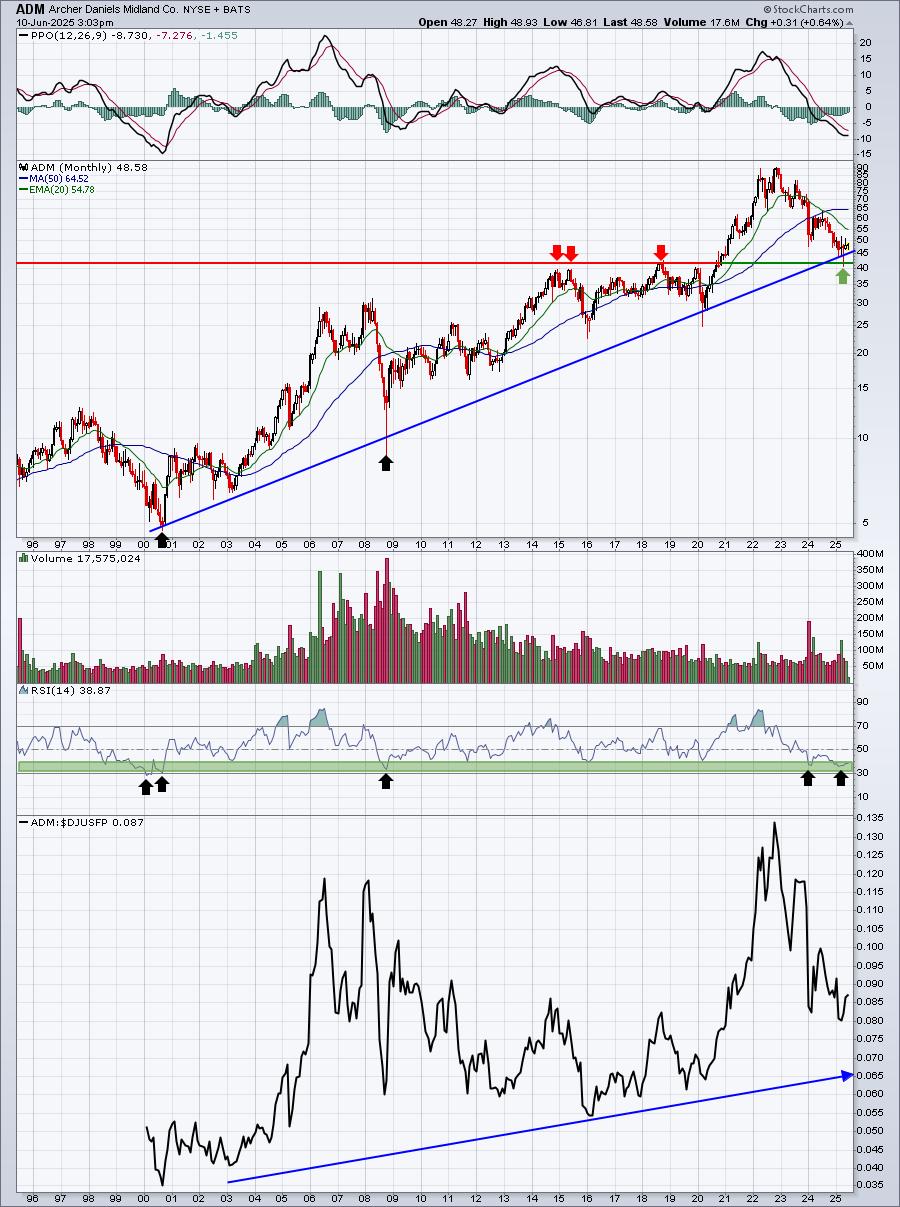
There are several reasons to like ADM here on the long-term chart. Both price and trendline support have just been tested in the 42-45 area. Monthly RSI is at 39, which historically has been a great time to think about entering ADM. Finally, the long-term relative strength has been climbing for a quarter century.
Then we can move to the current weekly chart, with the bullish longer-term monthly chart in mind:
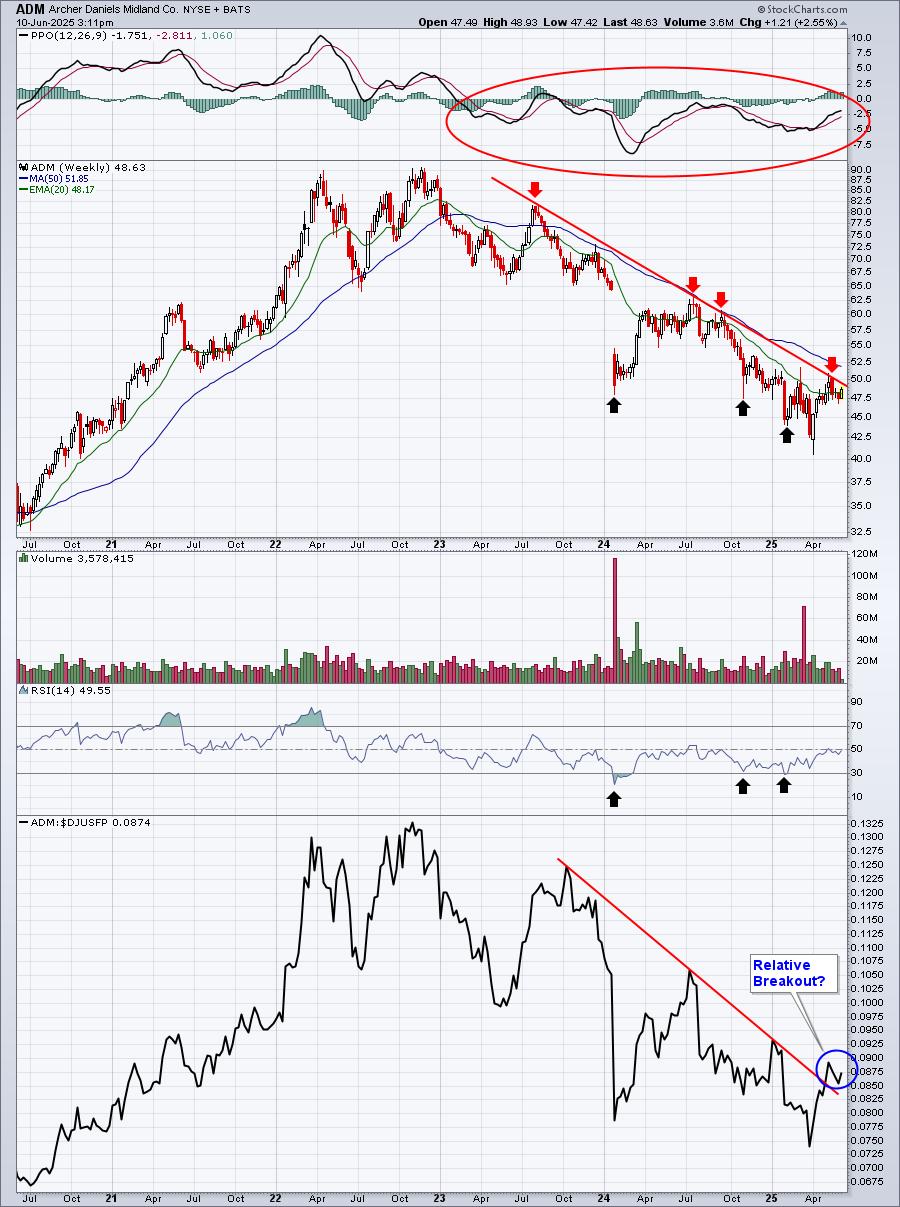
Outside of a possible relative strength breakout, there's not much to like here YET. It appears that a move above the $50 level would break the series of tops since 2023. We should also watch for the weekly RSI to move back through 50 and for the weekly PPO to clear centerline resistance. A combination of all those technical developments would start to put the bulls back in control, supporting that long-term monthly chart.
Finally, let's zero in on a potential bottoming reverse head & shoulders pattern on the daily chart:
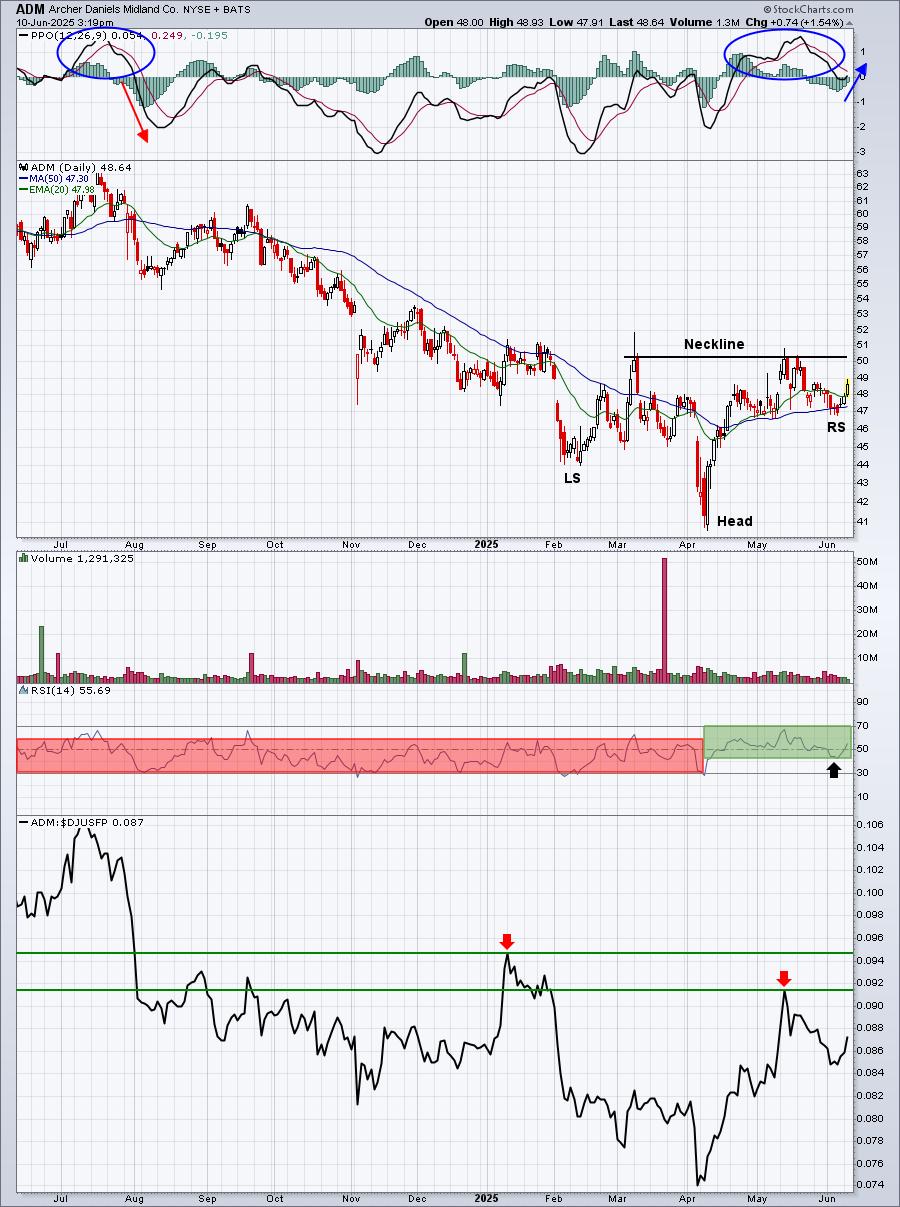
We're awaiting a breakout above neckline resistance on the daily chart. Such a breakout would also aid the weekly chart by clearing that downtrend resistance line that intersects at 50. The bottoming reverse head & shoulders pattern is very easy to spot, suggesting that traders will likely jump in, buy, and support a neckline breakout. The RSI now seems to be behaving as though ADM is in an uptrend. RSI is trending between 40 and 70, breaking away from its multi-year pattern of trending between 30 and 60. Also, if you look at the PPO the last time it broke above centerline resistance and into positive territory, it quickly reversed and fell below PPO centerline support. Currently, it looks as though the PPO is curling back to the upside from its centerline test, a bullish development indeed.
This is how I use perspective to evaluate a potential trade. While I wouldn't say that ADM is in a bullish uptrend just yet, the long-term chart is telling me this is a great area for a reversal. The daily reverse head & shoulders pattern is telling me that we simply need to see a neckline breakout for the daily chart to confirm that potential long-term price support buy signal on the monthly chart.
Upcoming Earnings
We now have our Upcoming Earnings ChartLists on our website, so be sure to check those out.
Economic Reports
None
Happy trading!
Tom