
EB Daily Market Report - Abbreviated - Wednesday, June 11, 2025
Executive Summary
- Futures were relatively flat leading up to the May CPI report, which was released at 8:30am ET today
- May Core CPI was reported well below expectations and futures immediately jumped, as expected
- Our major indices have turned negative this afternoon, however, despite the tame inflation report
- The Volatility Index ($VIX, +4.84%) climbed nearly 10% in less than an hour as stock prices retreated in the early afternoon
- Leadership has rotated intraday; consumer discretionary (XLY, -0.89%) was among the sector leaders in the early going today, but now ranks 10th out of 11 sectors for the session
- Technology (XLK, -0.36%) has seen a similar reversal of fortune, though I wouldn't call this any kind of major reversal looking out over the next several weeks
- Crude oil ($WTIC, +4.29%) is surging and energy (XLE, +1.34%) is today's best-performing sector
- Gold ($GOLD, +0.77%) is having a solid day relative to U.S. stocks with the VIX pushing higher
IWM Update
The stock market is showing a bit of a reversal today, which isn't overly worrisome given the huge rally off the April 7th low. It's difficult and completely irresponsible to think we're going to move higher every day without any sort of pause. I decided to look at the IWM and the small cap growth vs. small cap value ratio to see if correlation yielded any clues in IWM direction in the past. Here's what I came up with:
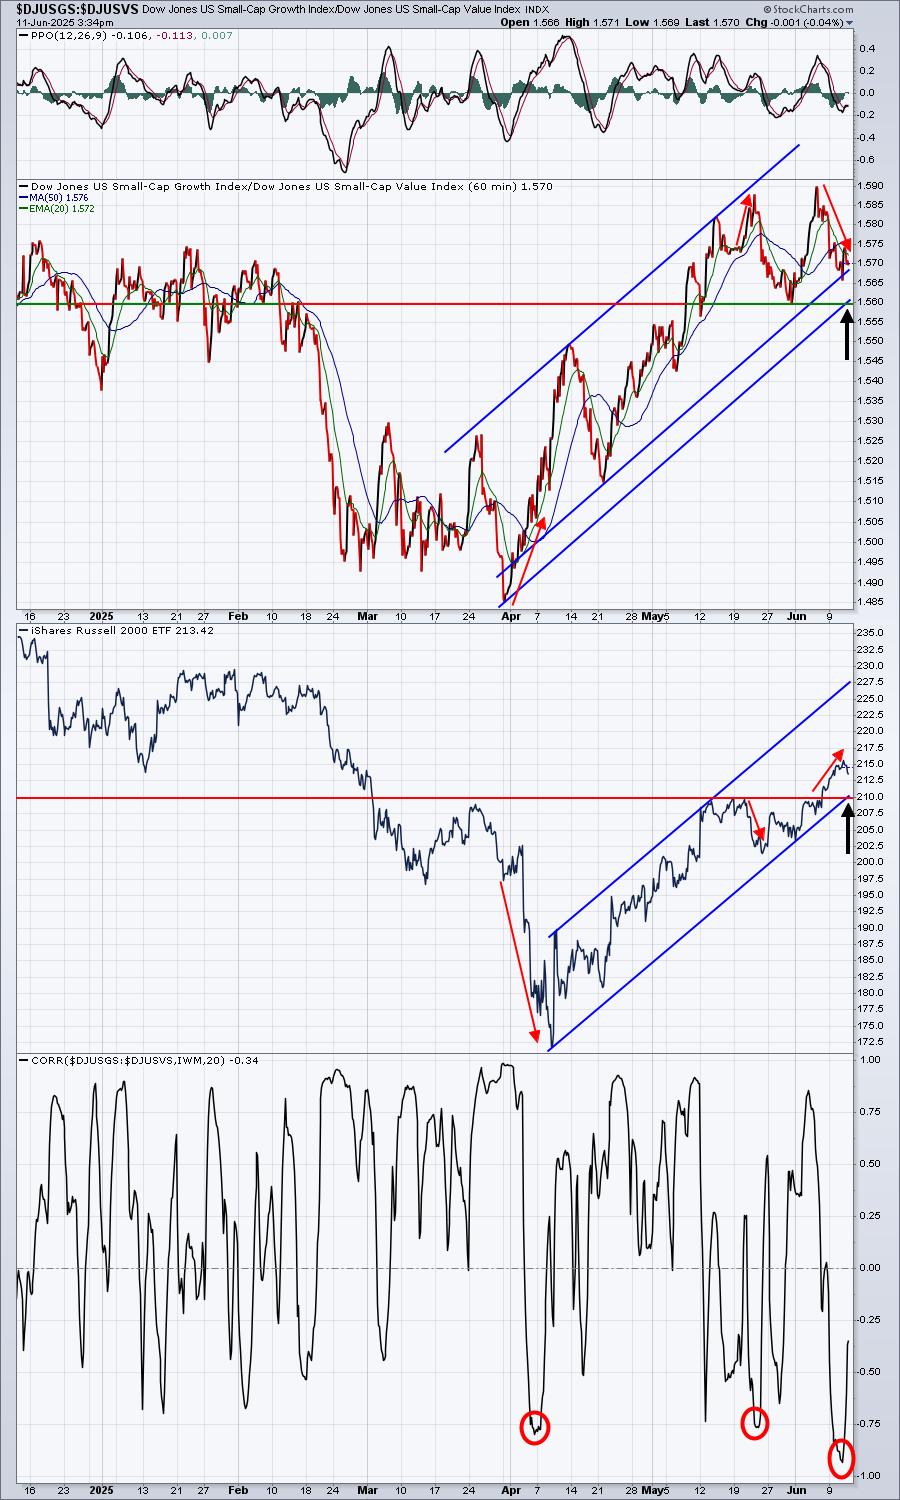
This relationship is generally positively correlated, meaning that the IWM has a greater tendency to move higher when small cap growth is outperforming small cap value ($DJUSGS:$DJUSVS). This makes pretty good common sense to me. I noted with red circles the 3 times that we saw inverse, or negative, correlation and the prior 2 (in April and May) resulted in at least a short-term reversal in the IWM. So perhaps the current inverse correlation leads to a bit of selling on the IWM - perhaps back to the recent breakout level? I used blue lines above to highlight channels/trends, while the black directional lines point to what I believe is key support or relative support.
This chart will be interesting to follow as we move forward. Remember, this analysis style/strategy is fairly new and I haven't backtested it, so be careful putting too much emphasis on it at this point. I did find it interesting though and so I wanted to share it.
I chose to lessen my exposure to the leveraged TNA (3x IWM) when the IWM moved below yesterday's low, which was a violation of sorts with respect to the IWM's recent trend higher. The proceeds were reinvested in the IWM, so I simply have less leverage now that I have over the past couple weeks. I'll likely consider increasing my leveraged exposure if the IWM tests the recent neckline breakout at 210-211.
ChartLists and Trading Strategies
I haven't changed my strategy yet on buying small cap stocks, but I'm certainly considering it after the reverse head & shoulders breakout on the IWM above 210-211. Accordingly, I'll be putting together a Small Cap WatchList that features stocks that I believe could significantly outperform the IWM if small caps do take over a leadership role among U.S. stocks.
Upcoming Earnings
We now have our Upcoming Earnings ChartLists on our website, so be sure to check those out.
Economic Reports
May CPI: +0.1% (actual) vs. +0.2% (estimate)
May Core CPI: +0.1% (actual) vs. +0.3% (estimate)
Happy trading!
Tom