
EB Daily Market Report - Thursday, June 12, 2025
Executive Summary
- Futures were red overnight and our major indices opened to the downside
- Yet another inflation report, this time the May PPI, came in well below expectations, but failed to spark an opening rally
- We saw improvement in key indices after the opening bell, but the latest action shows prices on the decline as I write this report
- Cryptocurrencies are taking a breather as "risk on" investments take a back seat for now
- Meanwhile, commodities have picked up the slack with gold ($GOLD, +1.88%) back above 3400 per ounce and crude oil ($WTIC, +0.21%) jumping again, this time above $68 per barrel
- The 10-year treasury yield ($TNX) has dropped another 5 basis points to 4.36% after another tame inflation report
- Technology (XLK, +0.99%) leads the action today, but the rest of today's strength is from more value-oriented areas like utilities (XLU, +0.72%) and health care (XLV, +0.47%)
- Oracle Corp (ORCL, +14.48%) is leading the S&P 500 higher after a solid quarterly earnings report after the bell on Wednesday
Market Outlook
Here's the latest on the S&P 500:
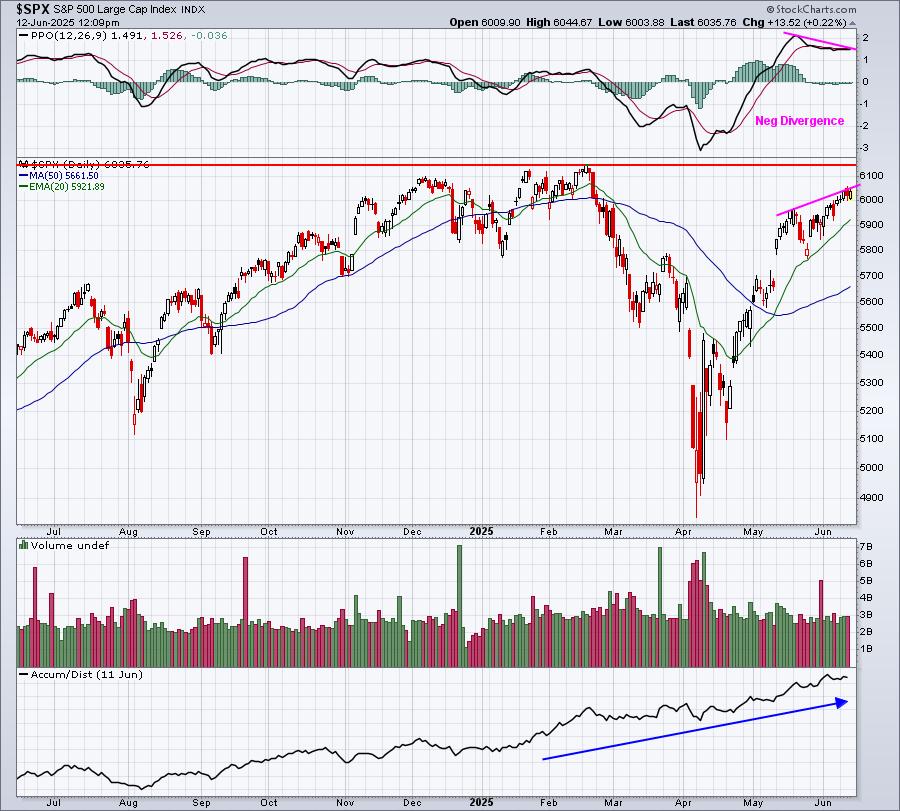
There are clear positives right now, including the consistently-rising AD line and the price action that has remained above the rising 20-day EMA for nearly two months now. The potential negatives, however, include upcoming all-time high price resistance at 6144, which could limit upside from here - at least until we get a confirmed breakout. Slowing momentum could also be an issue potentially as a negative divergence has formed.
While I see further upside ahead ultimately, we should probably be thinking about lowering our short-term market expectations as Q2 winds down. I hope I'm wrong, but we do seem to be slowing down a bit.
Sectors/Industries
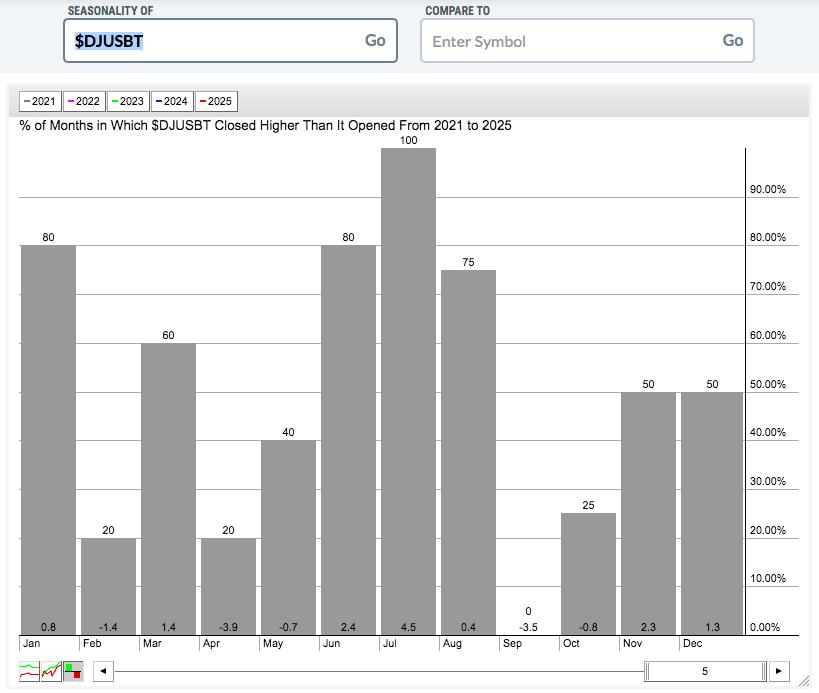
I'm keeping a close eye on the biotechnology group ($DJUSBT). Health care (XLV) has been improving and biotechs typically perform well historically from June through August. Check out the seasonality for the $DJUSBT over the past 5 years and then again over the past 13 years (during the current secular bull market):
Past 5 Years
Past 13 Years
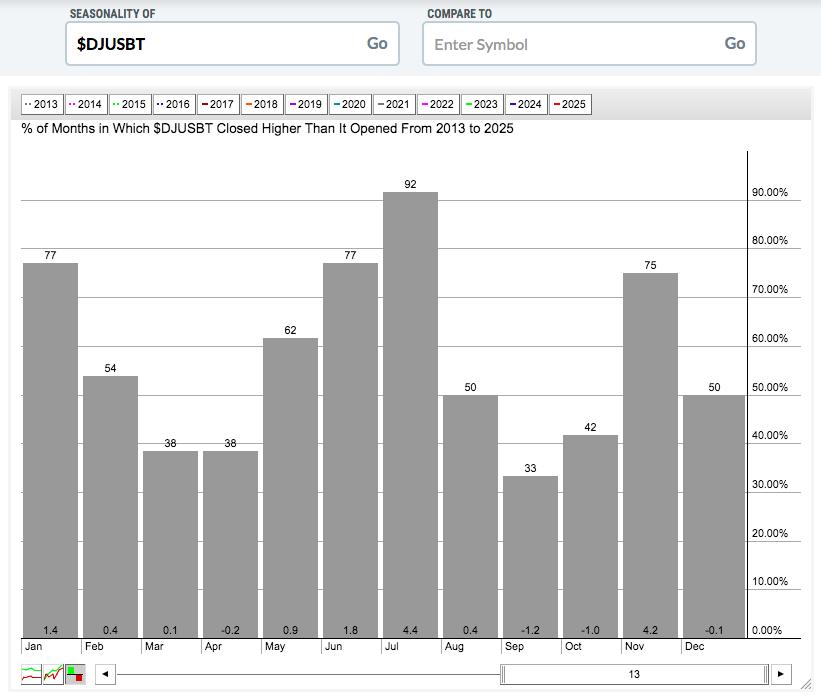
There's no doubt that summertime is when biotechs seem to do their best - even over the past 5 years, which have been rough years for this industry group.
Technically, biotech has surged off its recent low, but there's still clear overhead resistance to negotiate. If this resistance is cleared, however, biotechs could be off and running during the summer once again:
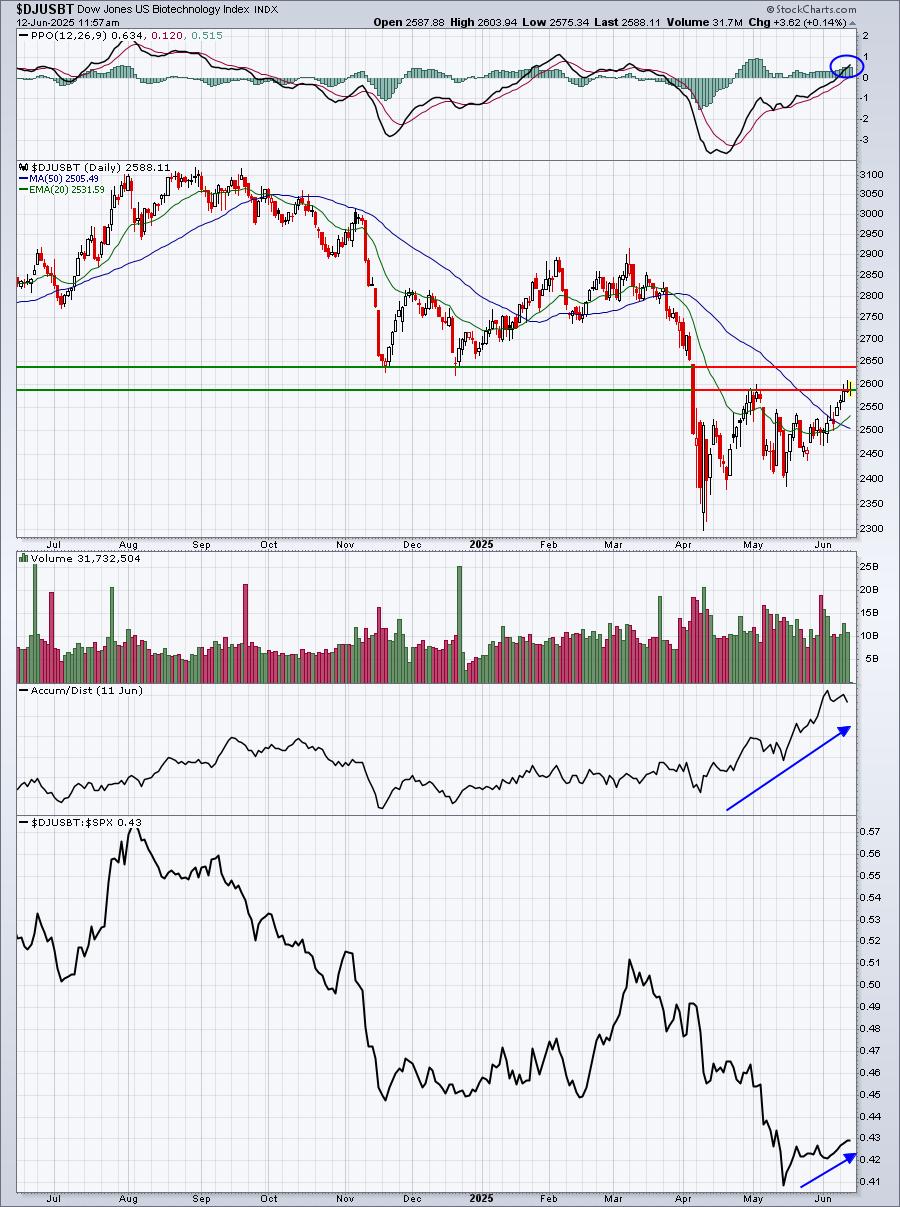
The improvement on this chart is fairly apparent as relative strength has begun to improve, we've seen a bullish PPO crossover, and the AD line has been soaring of late. However, the biggest issue on this chart has not been resolved and that's price resistance.
For very aggressive traders, LABU, which is a 3x leveraged ETF that tracks the XBI (biotech ETF), could be considered over the next few months, but I'd definitely want to see a breakout to feel better about taking on leverage. PLEASE keep in mind that ALL leveraged products are extremely risky and should only be considered by those traders with a high risk mentality. Gains can be extreme, but so can losses.
ChartLists and Trading Strategies
If you like investing for the long-term and in income-producing stocks, you might want to watch my StockCharts.com YouTube video that was uploaded earlier today. I featured Archer Daniels Midland (ADM) and how I view it over 3 different timeframes - monthly, weekly, and daily. Interestingly, if a key bullish technical pattern executes on the daily chart, it also produces bullish signals on ADM's weekly and monthly charts. Having a stock set up bullishly on three different timeframes generally results in the ability to limit risk as well. Here's the link:
For this ADM setup, you can use the timestamp provided and move to the 21:42 mark of the video.
Upcoming Earnings
We now have our Upcoming Earnings ChartLists on our website, so be sure to check those out.
Economic Reports
Initial jobless claims: 248,000 (actual) vs. 243,000 (estimate)
May PPI: +0.1% (actual) vs. +0.2% (estimate)
May Core PPI: +0.1% (actual) vs. +0.3% (estimate)
Happy trading!
Tom