
EB Daily Market Report - Thursday, June 26, 2025
Executive Summary
- Futures were higher overnight and our major indices gapped higher at the opening bell
- The NASDAQ has extended its strength further into record high territory, led by all-time highs in semiconductors ($DJUSSC, +0.96%) and software ($DJUSSW, +0.69%)
- The S&P 500 is nearing its all-time high at 6147
- Commodities are mostly higher and includes a nice jump in copper prices ($COPPER, +3.11%) back above the $5 level
- The 10-year treasury yield ($TNX) is down another 3 basis points to 4.26% after the final revision of Q1 GDP showed it was weaker than previously thought at -0.5%
- Pending home sales jumped 1.8%, more than expected, but has had little impact on home construction stocks ($DJUSHB, +0.07%)
- Renewable energy stocks ($DWCREE, +3.22%) are strong on the session and Enphase Energy (ENPH, +10.47%) is the best-performing stock in the S&P 500
- Micron Technology (MU, -2.28%) reported revenues and EPS that crushed estimates, but much of that may have already been built into the stock price as MU has sold off since the opening bell
Market Outlook
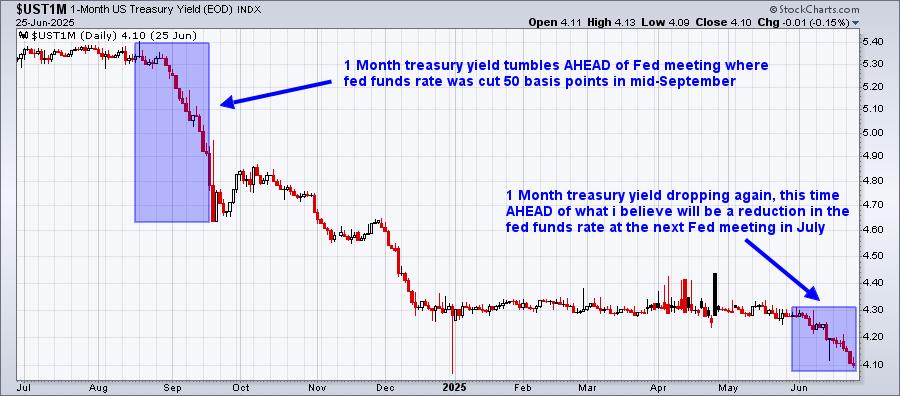
The S&P 500 is trading up another 0.7% today as the index trades at 6134, just 10 points away from its all-time high close and just 13 points away from its all-time intraday high. I said we were going to push back to all-time highs off that April low and here we are. Make no mistake about it, though, we will not be stopping here. I see prices continuing to move higher, and they might even accelerate to the upside, because of an upcoming rate cut. Yep, you heard me right! I believe the Fed is going to cut the fed funds rate next month, barring an unforeseen spike in inflation between now and then. The treasury market is beginning to price it in. Check this out:
Sectors/Industries
The small cap IWM (ETF that tracks the Russell 2000) is having another solid day and is once again on the verge of a very significant breakout:
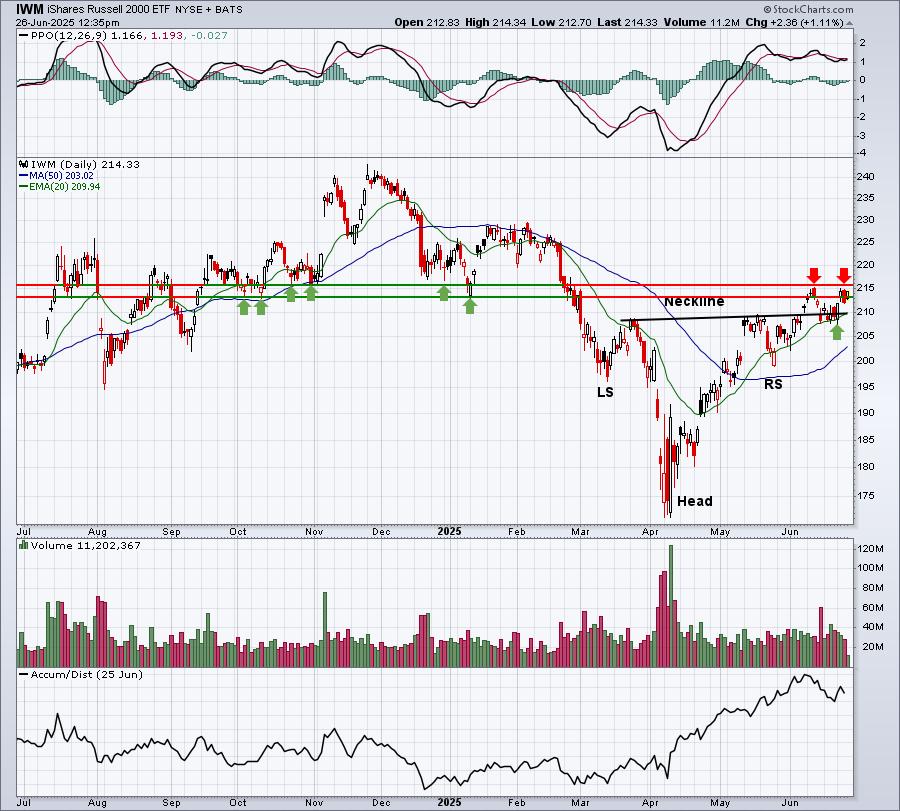
The reverse head & shoulders pattern, which was bullish and executed on the neckline breakout in early June, held rising 20-day EMA support and another breakout above 215-216 would really add to the potential bullish impact.
ChartLists and Trading Strategies
Uptrending stocks that pullback for a period of time will many times see their daily RSI drop down close to 40 before picking up steam and turning higher again. On our website, we have an RSI scan where we can run it against one or more of our ChartLists. Today, I ran this scan and adjusted the RSI to be greater than 40, but less than 45. I ran it against our Raised Guidance ChartList (RGCL) and 35 stocks were returned. Those with SCTR scores above 70 included EVER, LRN, VSEC, XPEV EHAB, and LOPE.
Here's an interesting stock from this list of 6:
VSEC:
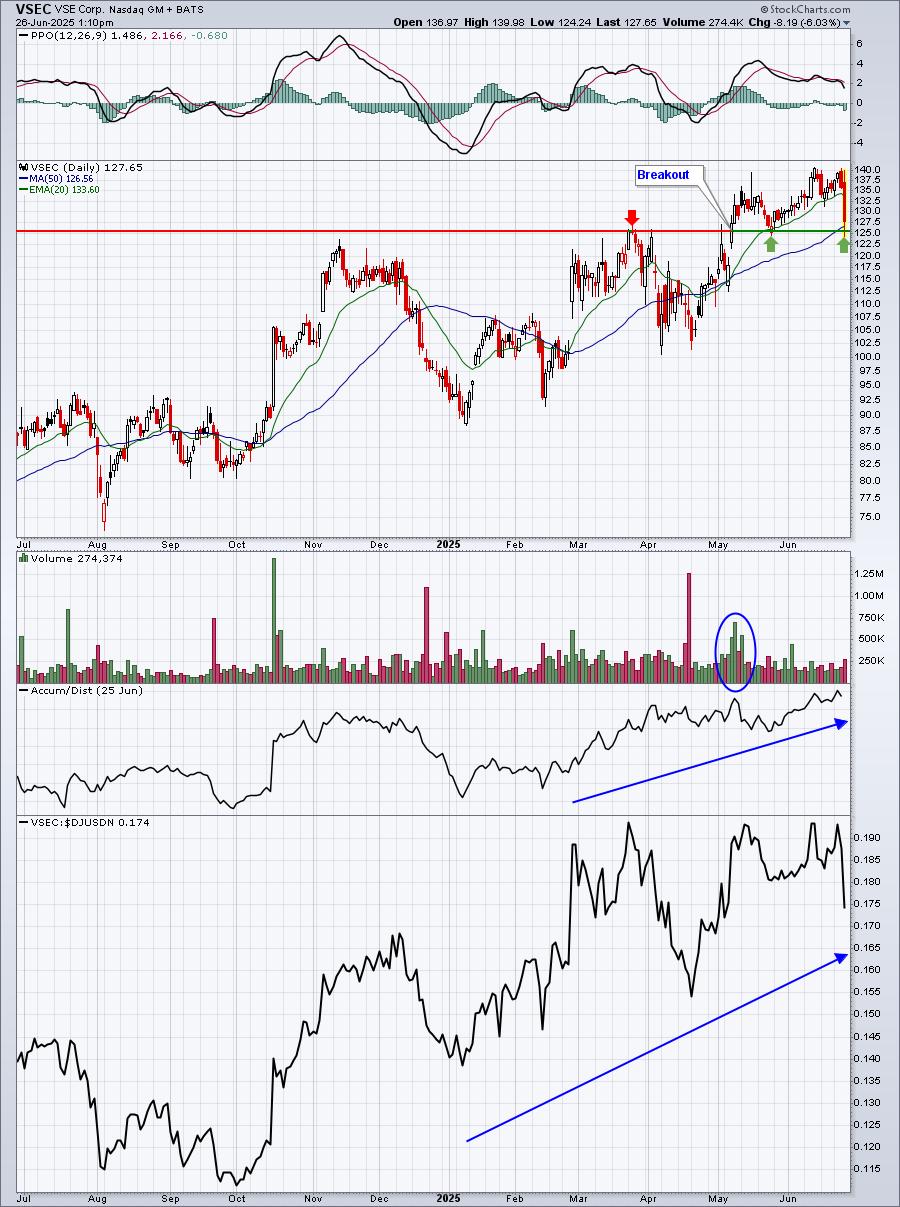
I see a leading stock in a leading industry group that sold off hard to test key price support and its rising 50-day SMA. Further weakness into the close could be problematic, but a strong finish will likely have marked a bottom.
Upcoming Earnings
We now have our Upcoming Earnings ChartLists on our website, so be sure to check those out.
Economic Reports
Initial jobless claims: 236,000 (actual) vs. 245,000 (prior)
Q1 GDP (final): -0.5% (actual) vs. -0.2% (estimate)
Q1 PCE - annual rate (final): +0.5% (actual) vs. +1.2% (estimate)
May durable goods orders: +16.4% (actual) vs. +7.0% (prior)
May durable goods orders - ex transports: +0.5% (actual) vs. +0.1% (estimate)
May pending home sales: +1.8% (actual) vs. +0.5% (estimate)
Happy trading!
Tom