
EB Daily Market Report - Wednesday, July 16, 2025
Small Cap Video
I wanted to apologize for our oversight on the recent small cap video that we sent out to all of our members. We thought we had included charts, but we had not. We've remedied that issue and here is the link where you can now watch the video WITH charts included. Again, my apologies!
Executive Summary
- Futures were mixed and improving after the June PPI report was released, showing that inflation at the producer level was once again benign
- Our major indices gapped up, but yesterday's selloff quickly resumed, sending our major indices down to or near rising 20-day EMA support
- Cryptocurrencies are having a strong session, led by solana ($SOLUSD, +6.42%) and etherium ($ETHUSD, +6.20%)
- Commodities are mixed today, though crude oil ($WTIC, -0.72%) has fallen back to $66 per barrel
- Despite the benign inflation report, the 10-year treasury yield ($TNX) has barely budged to the downside, falling just 1 basis point to 4.48%
- There's bifurcated action at the sector level with 4 sectors higher, led by health care (XLV, +0.97%), and 7 sectors lower; technology (XLK, -0.54%) and energy (XLE, -0.54%) lag
- Pharmaceuticals ($DJUSPR, +2.61%) are leading health care higher, buoyed by strong quarterly results from Johnson & Johnson (JNJ, +6.12%)
- Banks ($DJUSBK, -0.62%) are lower again as more large banks report quarterly results; Bank of America (BAC, -1.52%) is lower, despite beating its consensus earnings estimate
Market Outlook
It's options-expiration week and at our Max Pain session last night, I discussed what likely would be a period of consolidation, possibly even some selling. The net in-the-money call premium suggests that market makers have incentive to drive prices a bit lower this week. We're not anticipating a big selloff, but certainly we cannot rule out 20-day EMA tests. The S&P 500, just a day after moving above 6300 intraday for the first time in its history, fell back to approach its rising 20-day EMA:
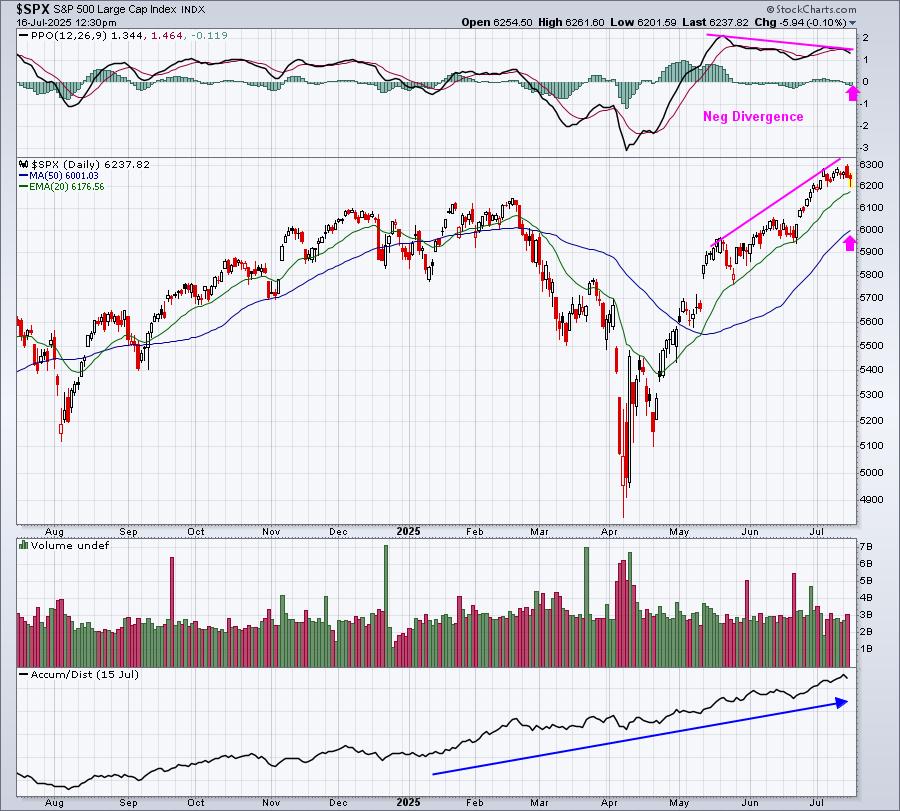
Any time we see a negative divergence, there's an increased likelihood (not guarantee) that we could see a 50-day SMA test and/or a PPO centerline test (pink arrows). It's simply an added level of risk that we need to be aware of. It's also options-expiration week, which suggests lower prices. Throw in the historical fact that the July 17th close through the July 23rd close is the 3rd worst week of the calendar year historically since 1950 and it's easy to see further selling here. I really am not expecting a major selloff, but a trip to the 20-day EMA is definitely a short-term possibility and, if the selling intensifies, the 50-day SMA could come into play. I doubt we would see selling beyond that, if we even end up seeing much selling at all.
Sectors/Industries
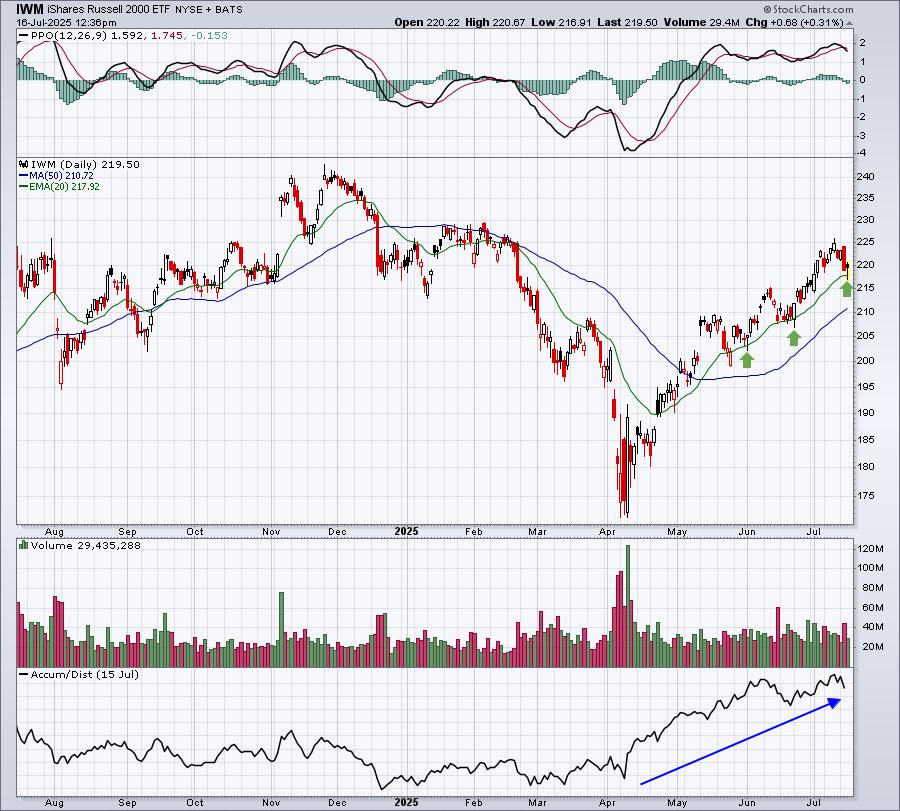
While we nearly tested the rising 20-day EMA on the S&P 500, that test did occur this morning on the small cap Russell 2000 (IWM):
ChartLists and Trading Strategies
Trading Tip: Keep in mind that our Bullish Trifecta ChartList (BTCL) represents stocks that are currently included on our Strong Earnings ChartList (SECL), Strong AD ChartList (SADCL), and Raised Guidance ChartList (RGCL). That means that any stock on the BTCL has the following attributes:
- Beat Wall Street consensus estimates as to both revenues and EPS in its latest quarter
- Shows a strong AD (accumulation/distribution) line, a sign of possible Wall Street accumulation
- Raised its revenue and/or EPS guidance within the last 90 days
- Is liquid (ie, trades at least 200,000-250,000 shares per day)
- Trades above $5 (we prefer to trade non-penny stocks)
Trading these BTCL stocks should provide us a certain level of confidence as they have strong technical and fundamental characteristics.
Upcoming Earnings
We have once again started including the Upcoming Earnings ChartLists for each day throughout earnings season. Be sure to check out our website for those ChartLists.
Economic Reports
June PPI: +0.0% (actual) vs. +0.2% (estimate)
June Core PPI: +0.0% (actual) vs. +0.2% (estimate)
June industrial production: +0.3% (actual) vs. +0.1% (estimate)
June capacity utilization: 77.6% (actual) vs. 77.4% (estimate)
Beige book released at 2:00pm ET
Happy trading!
Tom