
EB Daily Market Report - Tuesday, August 5, 2025
Executive Summary
- Futures were slightly higher overnight and we saw marginal gaps to the upside in our major indices
- While there's been mostly a downward trend in price action on the S&P 500 and NASDAQ 100, the small cap IWM has actually been gaining ground throughout much of this session AND the prior two sessions
- Cryptocurrencies are mostly lower today, led by etherium ($ETHUSD, -2.83%)
- Most commodities are also lower, especially crude oil ($WTIC, -1.72%), which has fallen back to $65 per barrel; gold ($GOLD, +0.24%) and silver ($SILVER, +1.39%) are bucking the trend
- 4 sectors are higher, while 7 are lower; materials (XLB, +0.67%) are leading the pack, while real estate (XLRE, +0.26%) regains strength as well
- Home construction ($DJUSHB, +1.68%) and home improvement ($DJUSHI, +1.41%) are leading a relatively strong consumer discretionary sector (XLY, +0.23%)
- Axon Enterprises (AXON, +15.49%) and Palantir (PLTR, +7.37%) are leading the S&P 500 today after reporting excellent quarterly results
- Advanced Micro Devices (AMD, -0.90%) will report its latest quarterly results after the bell today
Market Outlook
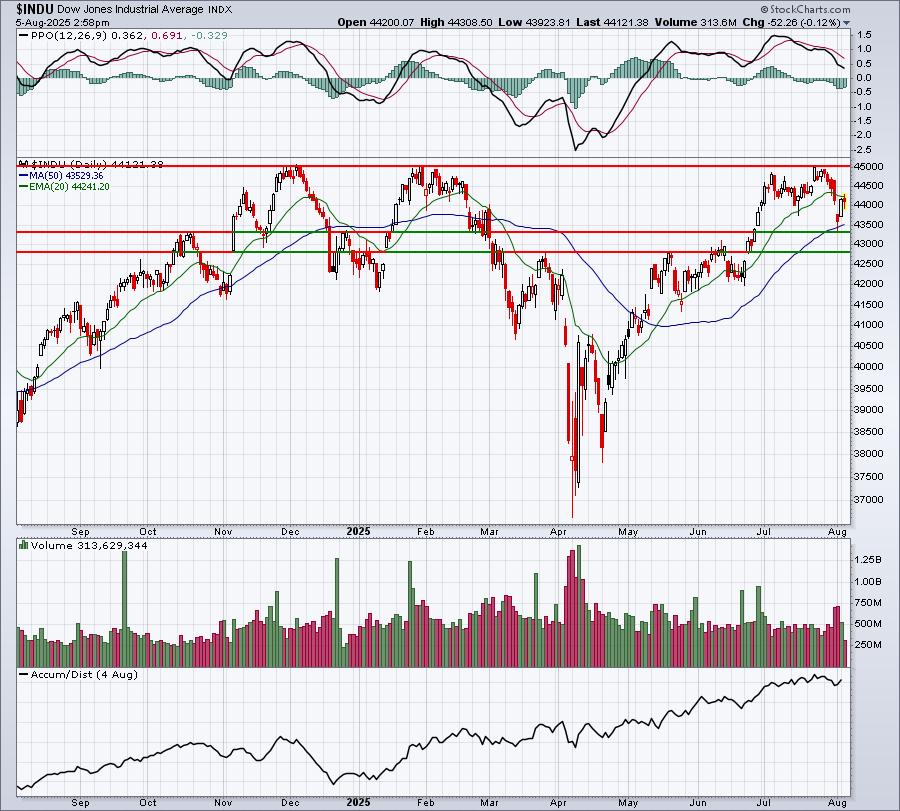
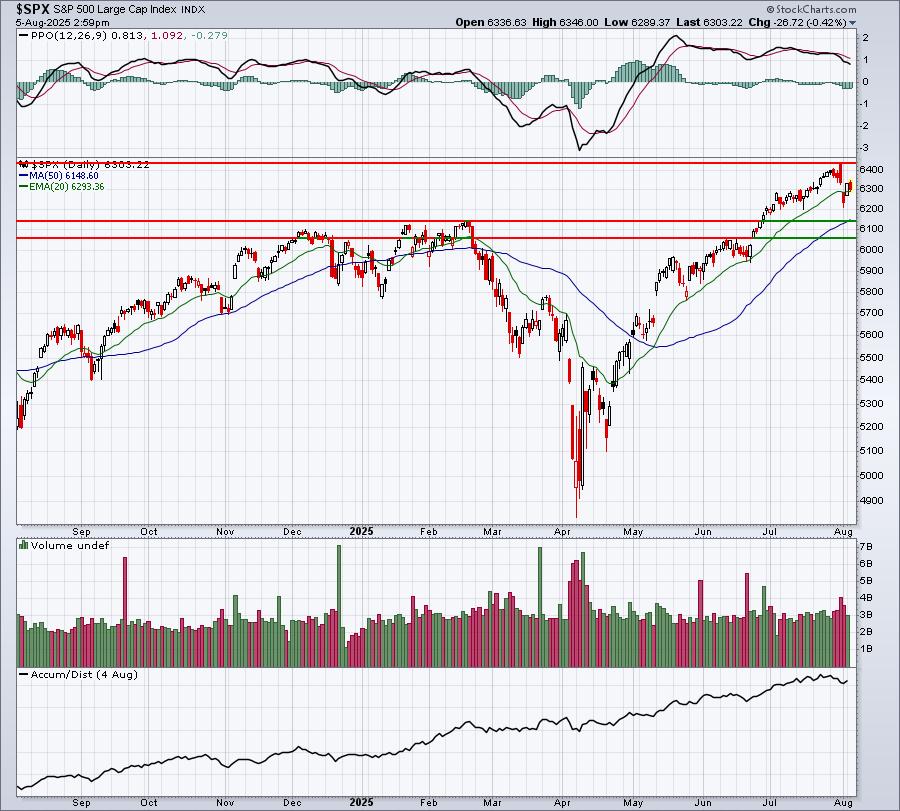
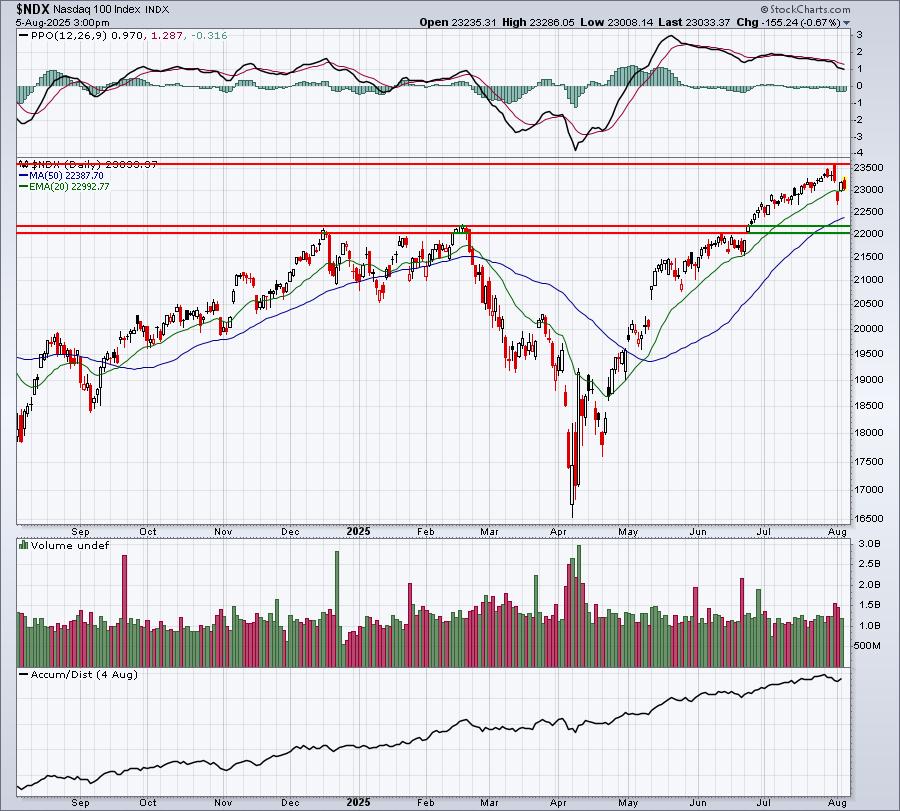
I've grown more cautious in recent days, so it probably makes sense to pull up a few index charts to see where we should expect key support to surface on any selling.
Dow Jones
S&P 500
NASDAQ 100
Russell 2000 (IWM)
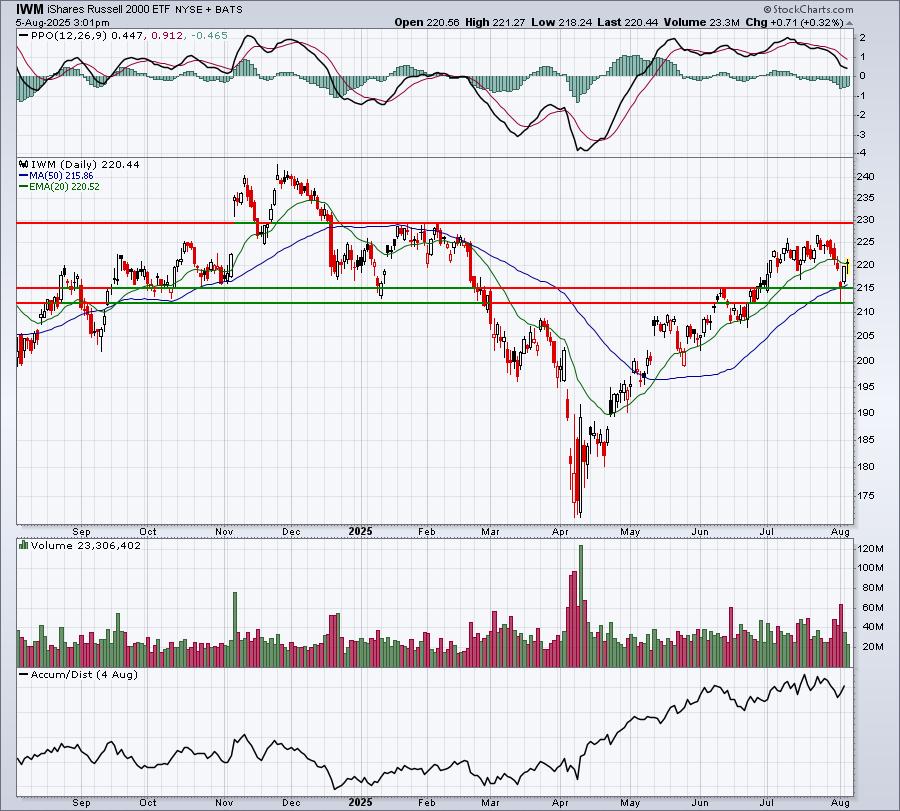
I've provided the key overhead level of price resistance that I'm watching and two fairly close levels of price support - if we see further downside over the next several weeks.
Last night, the NASDAQ got further good news when Palantir (PLTR) reported excellent quarterly results and gapped higher this morning. And like with last week's stellar reports by META and MSFT, the NASDAQ has been unable to hang onto earlier gains. It's developing into a common theme, which suggests to me that the market could be fully valued at this time and given the current interest rate environment. Should the stock market grow more optimistic about rate cuts, we could see another surge higher. Until then, let's keep in mind those recent price tops that I identified above and the fact that we've moved into a more challenging time of the year historically.
I do still really love the AD lines on all of our major indices. I'm 100% convinced that Wall Street has been accumulating and continues to do so. That means we'll see new record highs down the road, so don't grow too pessimistic if further selling kicks in. View it as an opportunity.
Sectors/Industries
I've spoken bullishly several times recently regarding home construction stocks ($DJUSHB) and they're higher again today as the 10-year treasury yield ($TNX) continues to drift lower, dipping down to 4.19% on the session. Another related group that also seems to be turning the corner is home improvement ($DJUSHI). Check out the chart:
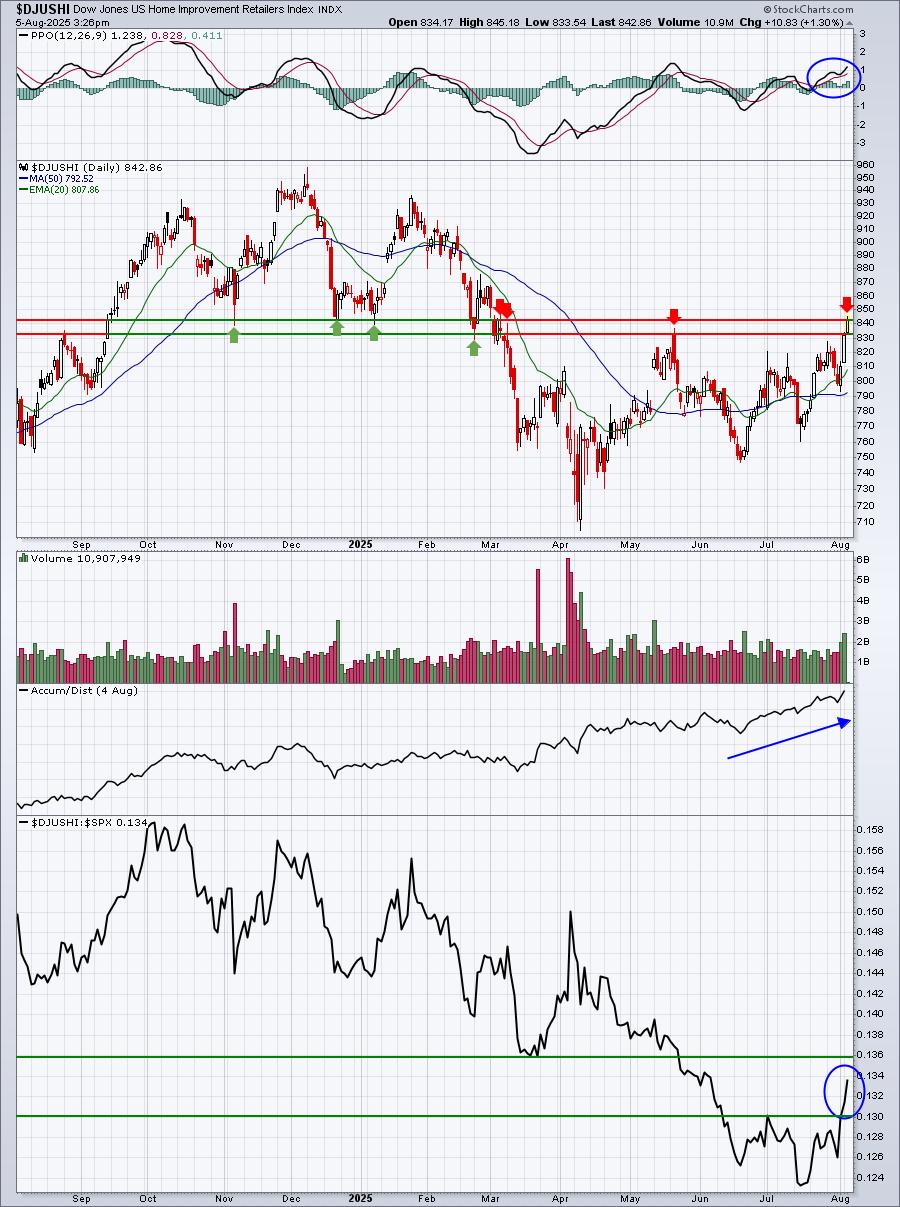
The DJUSHI isn't completely out of the woods just yet, but I see clear improvement on this chart. There's been a lot of price support/resistance in the 832-842 range over the past year and today we were able to clear 832. We are quite literally trading at 842 right now. Moving through that level on today's close would have to be viewed as a very bullish development, especially considering the strong AD line in play.
ChartLists and Trading Strategies
Let me give you an example of a stock that I would sell today - Enbridge (ENB), which is a strong stock off of our Strong Earnings ChartList (SECL):
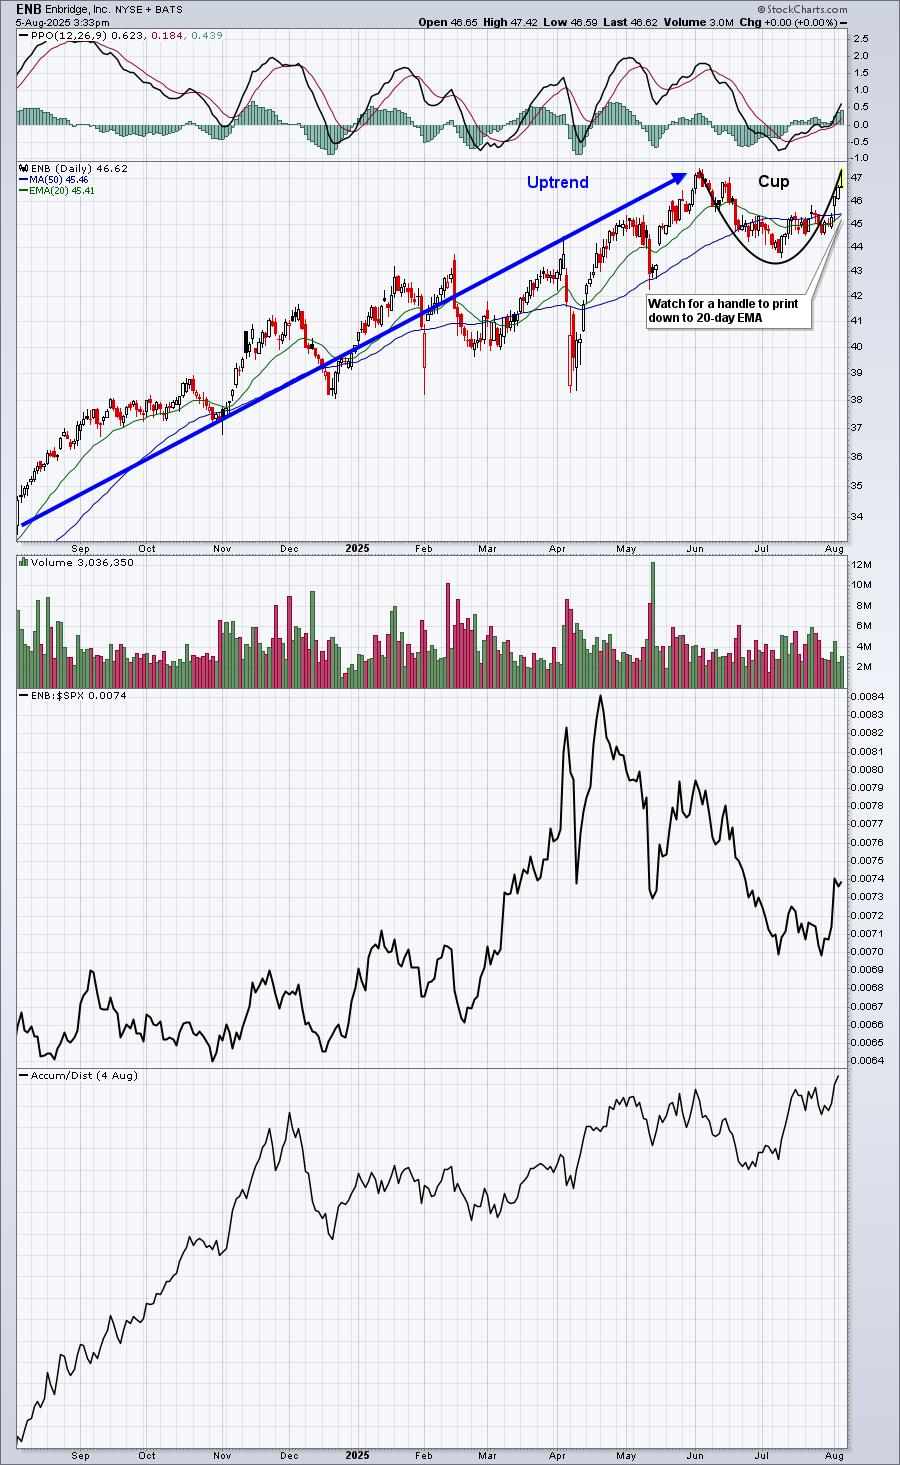
I don't like today's candle, plain and simple. ENB could easily forge to new highs tomorrow and I wouldn't care. ANYTIME I see a false breakout like the one that printed today on ENB and with a close back down near the low of the day, I exit. I see the right side of the cup being printed today with a likely 20-day EMA test forthcoming. If I had been in and sold today, I'd buy back on that handle printing at the 20-day EMA.
I often get the question, "When's the best time to sell?" Well, on ENB, I believe today represents a good time, even though it's a solid stock in an uptrend. I simply believe the risk of holding has increased because of the completion of the cup and the printing of a "shooting star" candle off of an uptrend.
Upcoming Earnings
We have included Upcoming Earnings ChartLists on our website for each day throughout earnings season (likely through late August). Be sure to check out these ChartLists on our website.
Economic Reports
July PMI composite: 55.1 (actual) vs. 54.6 (estimate)
July PMI services: 55.7 (actual) vs. 55.2 (estimate)
July ISM services: 50.1 (actual) vs. 51.5 (estimate)
Happy trading!
Tom