
EB Daily Market Report - Wednesday, August 27, 2025
Executive Summary
- Futures were a bit lower overnight and into the opening bell, but we've seen mostly strength since the opening bell
- The Russell 2000 (IWM, +0.65%) is again showing relative strength, led by regional banks (KRE, +1.25%)
- Cryptocurrencies are mostly higher, led by Solana ($SOLUSD, +6.91%)Many commodities are higher, including crude oil ($WTIC, +1.17%), which has jumped to $64 per barrel
- Gold ($GOLD, +0.42%) is close to $3450 per ounce, close to its all-time high, while the U.S. Dollar Index ($USD) meanders near 98, a fairly critical long-term support level
- The 10-year treasury yield ($TNX) is down 2 basis points to 4.24%, though it's been very quiet on the economic data front today
- Growth stocks (IWF, +0.20%) are again lagging value stocks (IWD, +0.34%), despite technology's (XLK, +0.47%) recovery from early-morning selling; the XLK now trails only energy (XLE, +1.24%) on the session
- Oil equipment & services ($DJUSOI, +1.74%) are strong and testing key resistance, as discussed below in Sectors/Industries
- NVIDIA Corp (NVDA, +0.10%) gets set to report its latest quarterly results after today's close and I'm expecting solid results, given NVDA's relative strength over the past several months
Market Outlook
By virtue of its recent breakout above 45000, the Dow Jones Industrial Average ($INDU) is showing renewed leadership and looks poised to move to a potential target of 53000 in time. Here's a weekly chart showing the bullish inverse head & shoulders pattern breakout and its ultimate measurement of 8000 additional points:
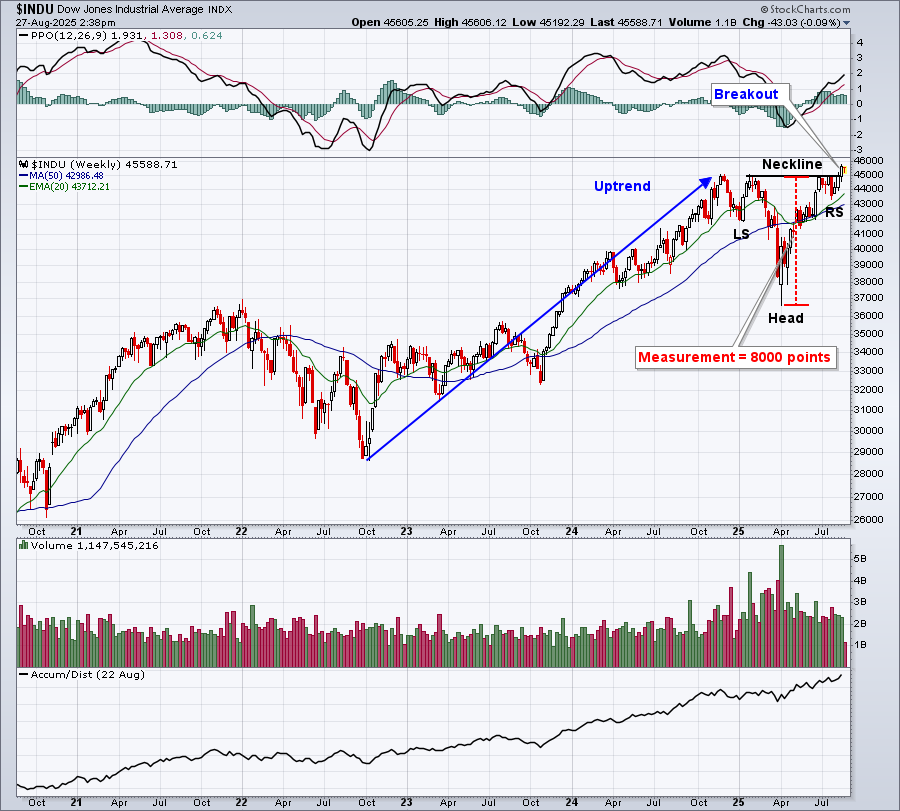
Breakouts of bullish continuation patterns like the inverse head & shoulders pattern only adds to the bullishness that I feel for the balance of 2025.
Sectors/Industries
I haven't looked much at energy as this sector hasn't been responsible for the strong performance in our major indices. Most of that strength has been due to strength primarily in technology (XLK), communication services (XLC), and consumer discretionary (XLY), and aided further by more recent strength in financials (XLF) and industrials (XLI). These last two tend to perform exceptionally well on both an absolute and relative basis from September through December.
But let's take a look at energy, particularly the oil equipment & services index ($DJUSOI) as this area of energy is showing strength today and has been uptrending since the early-April low:
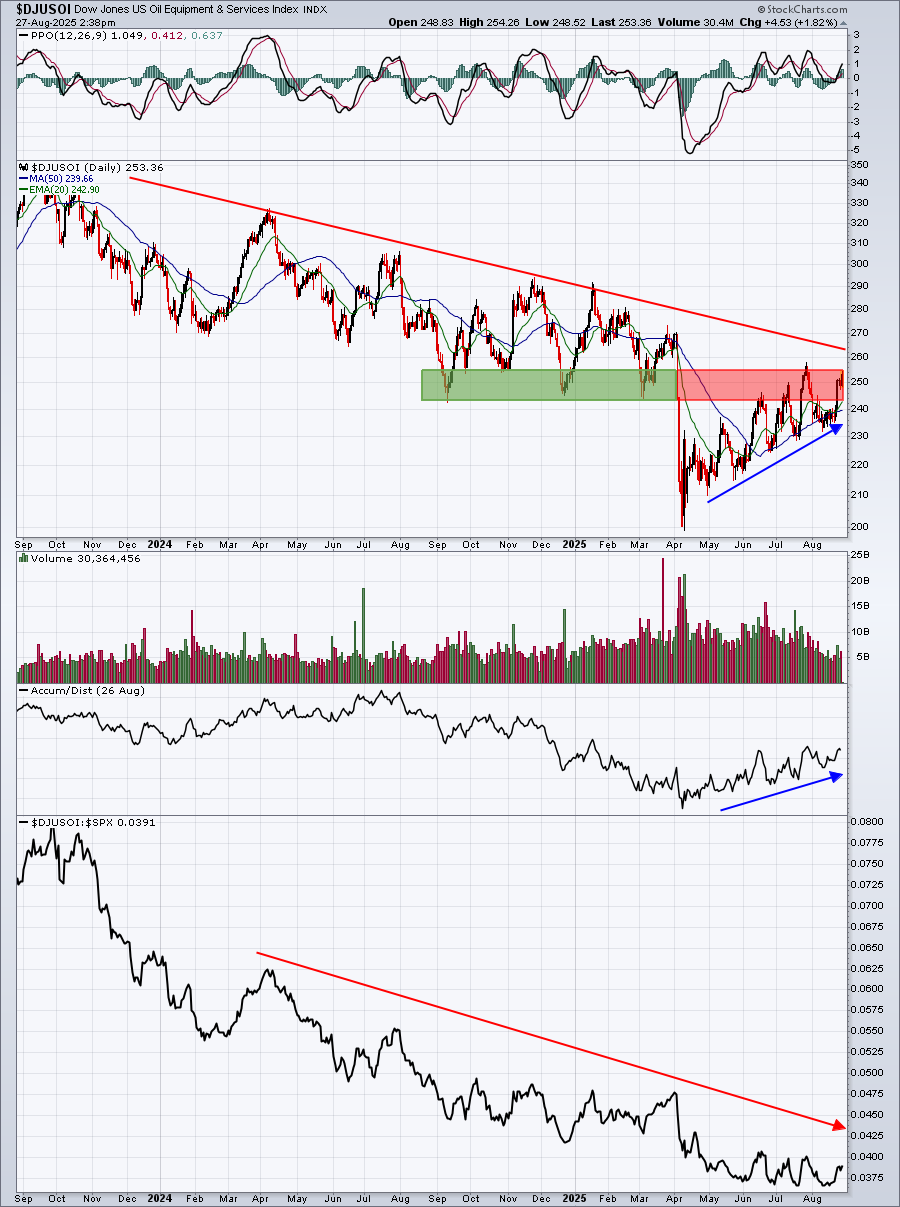
It's nice to see the price action trending higher. It's nice to see the AD line trending higher simultaneously. However, the most important part of this chart, in my opinion, is the bottom panel. The oil equipment & services index is not performing any better than the S&P 500, despite what appears to be solid improvement on the absolute chart. The bottom line is that investing in this industry group won't help you beat the benchmark S&P 500 - and the group is now staring at considerable price resistance just above its current price.
This is a primary reason why you don't hear me discussing energy stocks. They are now providing any consistent relative strength, notwithstanding today's bullish action.
ChartLists and Trading Strategies
I am continuing to trade mostly ETFs, including the DIA, IWM, and KRE, which track the Dow Jones Industrial Average, Russell 2000, and Regional Banks, respectively. However, I am trading more small caps, many from the list of small caps that I provided to EB members back in June 2025. As a reminder, here is that ChartList of 25 Small Cap stocks (my Top 10 are numbered amongst the 25) and the password you can use to unlock the charts:
Small Caps ChartList
Password: TP107456
Upcoming Earnings
We have included Upcoming Earnings ChartLists on our website for each day throughout earnings season (through this week). Be sure to check out these ChartLists on our website.
Economic Reports
None
Happy trading!
Tom