
EB Daily Market Report - Thursday, September 4, 2025
Important Note: I will be traveling to StockCharts.com this weekend and will be out in their Redmond, WA office all of next week. As a result, my schedule at EarningsBeats.com will be modified significantly. Below are the important changes that you should be aware of:
- There will be no Weekly Market Recap video this weekend
- There will be no LIVE Trading Room next Wednesday, September 10th
- I will try to update our ChartLists throughout my trip, but it's possible they won't be updated. I'll keep you posted.
- There will be no Weekly Portfolio Report this weekend
- I hope to provide Daily Market Reports as scheduled next week
- I hope to provide a Weekly Market Report on Monday as scheduled
Executive Summary
- Futures were higher overnight and we saw our major indices gap up at the opening bell
- The August ADP employment report came in weaker than expected, raising hopes of an interest rate cut at the upcoming September Fed meeting
- Strength has continued throughout much of the session with a bit of leadership from the Dow Jones Industrial Average ($INDU, +0.59%)
- Most cryptocurrencies are lower, with etherium ($ETHUSD, -3.49%) particularly weak as it trends lower after recently edging above its November 2021 all-time high
- Commodities are mostly lower, with crude oil ($WTIC, -0.72%) beneath $64 per barrel; gold ($GOLD, -0.86%) is seeing profit taking after closing above $3600 per bounce for the first time in history on Wednesday
- The 10-year treasury yield ($TNX) has dipped 3 basis points to 4.18%, its lowest level since the first trading day of May
- 9 of 11 sectors are higher, led by consumer discretionary (XLY, +1.35%) and financials (XLF, +0.97%)
- Broadline retailers ($DJUSRB, +2.95%) and home construction ($DJUSHB, +2.80%) are showing relative strength among discretionary stocks
- Mortgage finance ($DJUSMF, +1.73%) and banks ($DJUSBK, +1.47%) are providing a lift for the financials
- Amazon.com (AMZN, +4.11%) is among the best S&P 500 performers as it challenges its late-July high
Market Outlook
There's no question that the most concerning signal in the market right now is the rotation away from growth stocks. I'm not calling for a major top, because the consumer stock relationship remains bullish AND the rotation away from growth is fairly normal this time of year. Still, the sudden shift away from growth can be seen below and is worth at least monitoring:
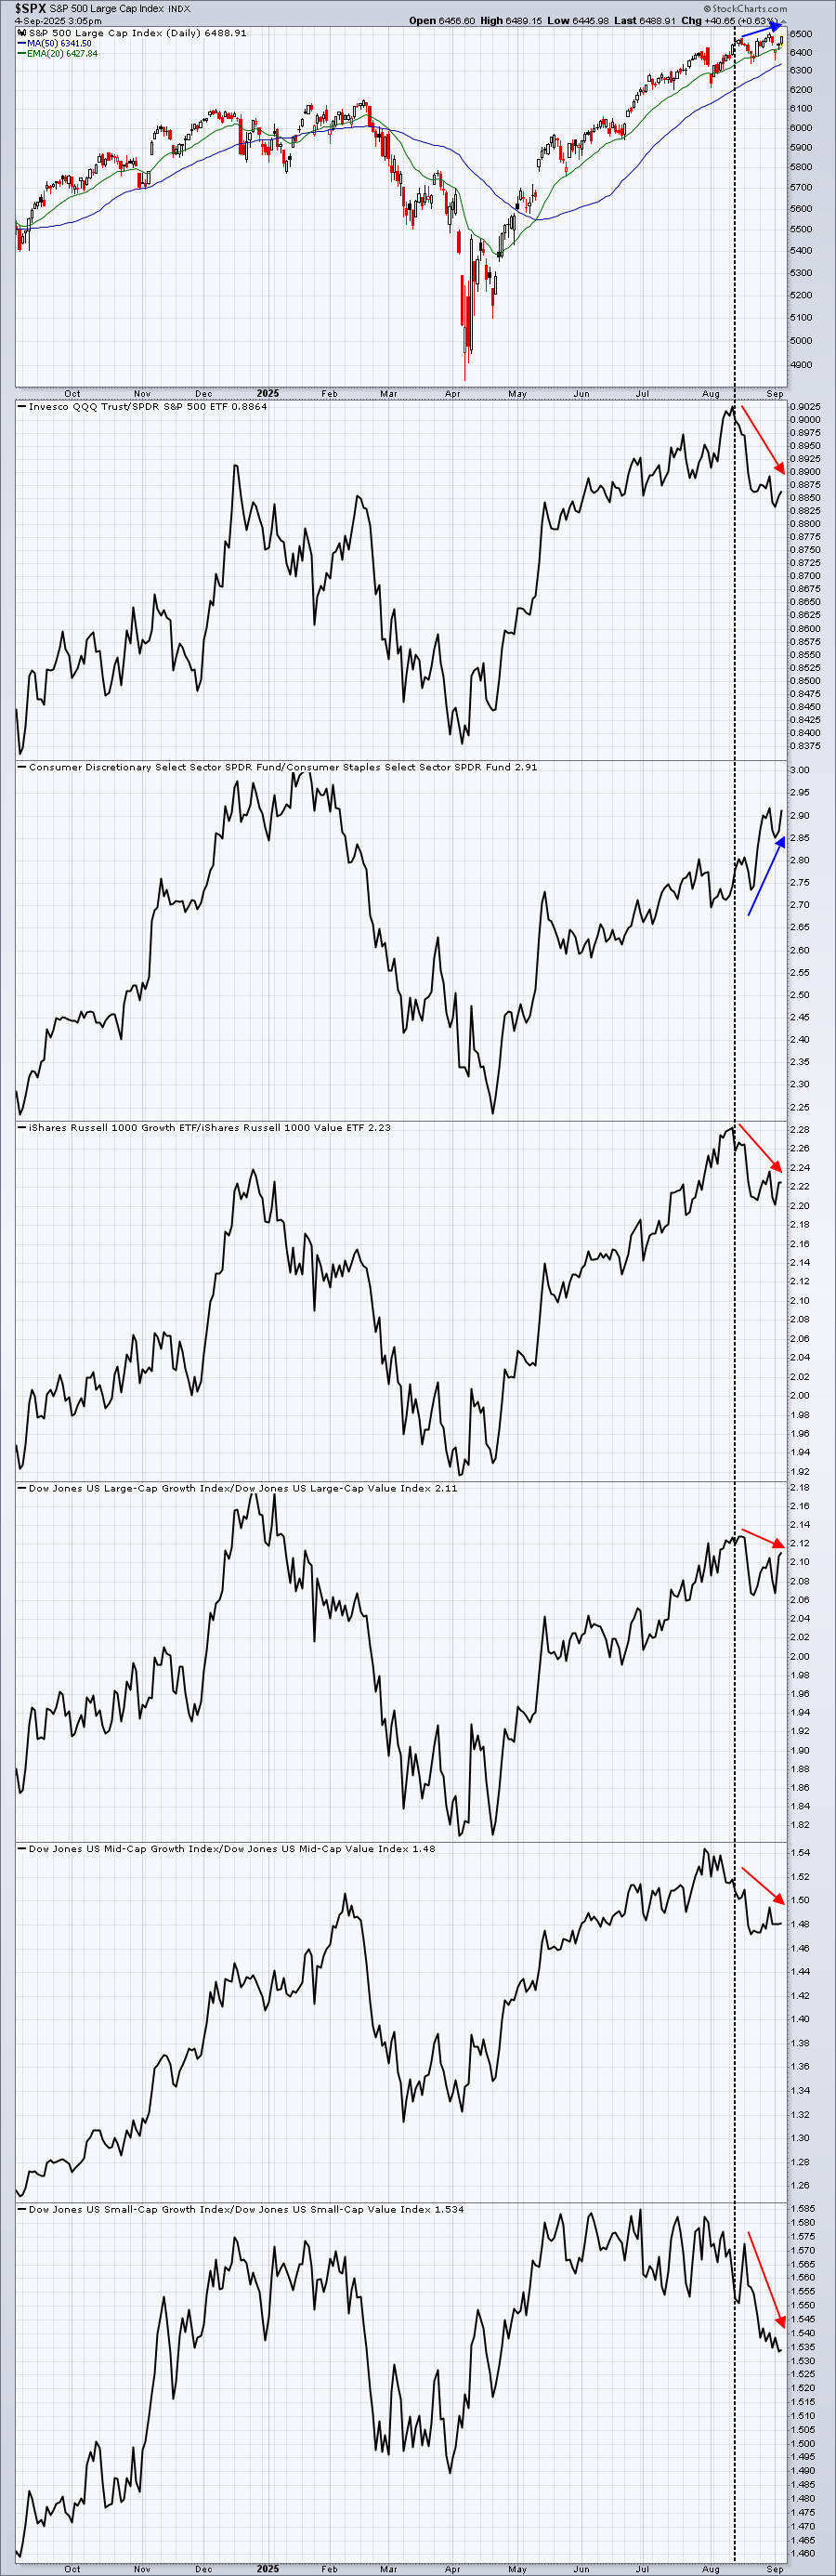
Money should absolutely rotate away from the XLY and into the XLP prior to a significant downturn and that ratio, which is my favorite ratio, remains strong and quite bullish. While I acknowledge things could get dicey in September or early October due to historical tendencies, I don't see a major downturn heading our way. To the contrary, once we get September behind us, I'm fully expecting the S&P 500 to move up to 7000 by year end.
Sectors/Industries
One key piece of the bullish puzzle right now is the semiconductor group ($DJUSSC), which shows gap support at 23,563.95 and price support just below 24,000. Check this out:
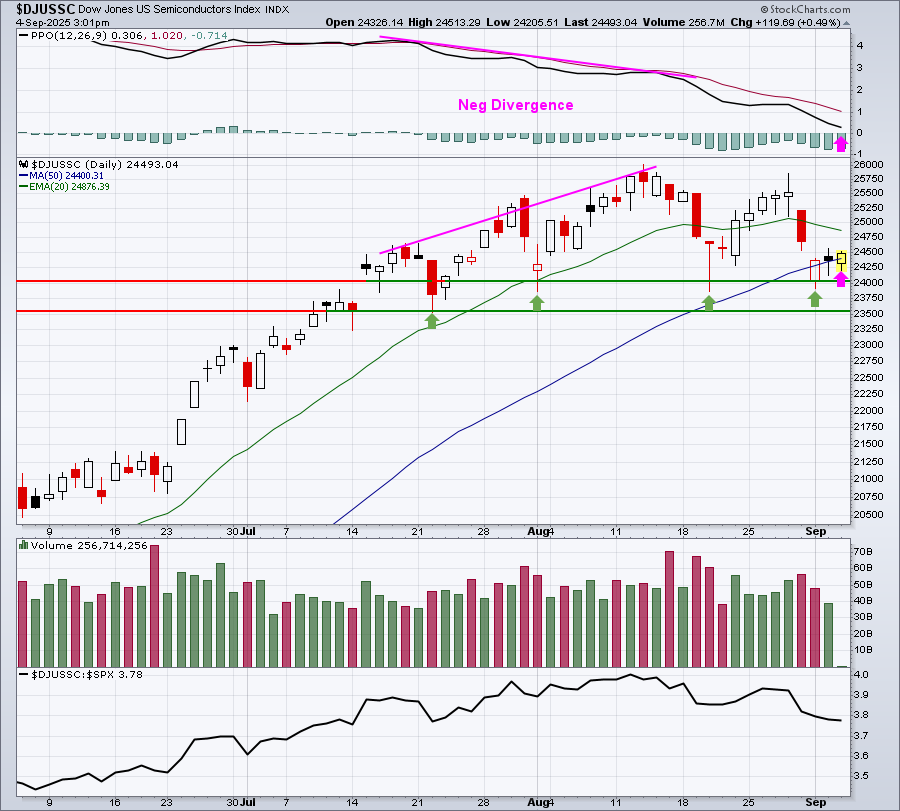
This group will likely be the determining factor as to how much selling we see in September. As long as the DJUSSC holds onto the gap and price support identified above, I believe any downside will be minimal. If, however, the DJUSSC breaks down beneath that gap support level, all bets are off.
There are two interesting things to mention on the above chart. First, the negative divergence that was present at the time of the price highs in July and August have essentially played out and "reset". The pink arrows mark the PPO centerline and the 50-day SMA, because these two levels are what I look for after a negative divergence emerges.
The second mention is that I could draw a topping head & shoulders pattern above with the lows on August 1st and August 20th representing the neckline at 23,870 and 23,857, respectively. A loss of gap support would then confirm this potential bearish pattern with a measurement down to roughly 21,500.
I don't believe we'll see this breakdown nor the potential measurement, but it's important to recognize the risks ahead of time.
ChartLists and Trading Strategies
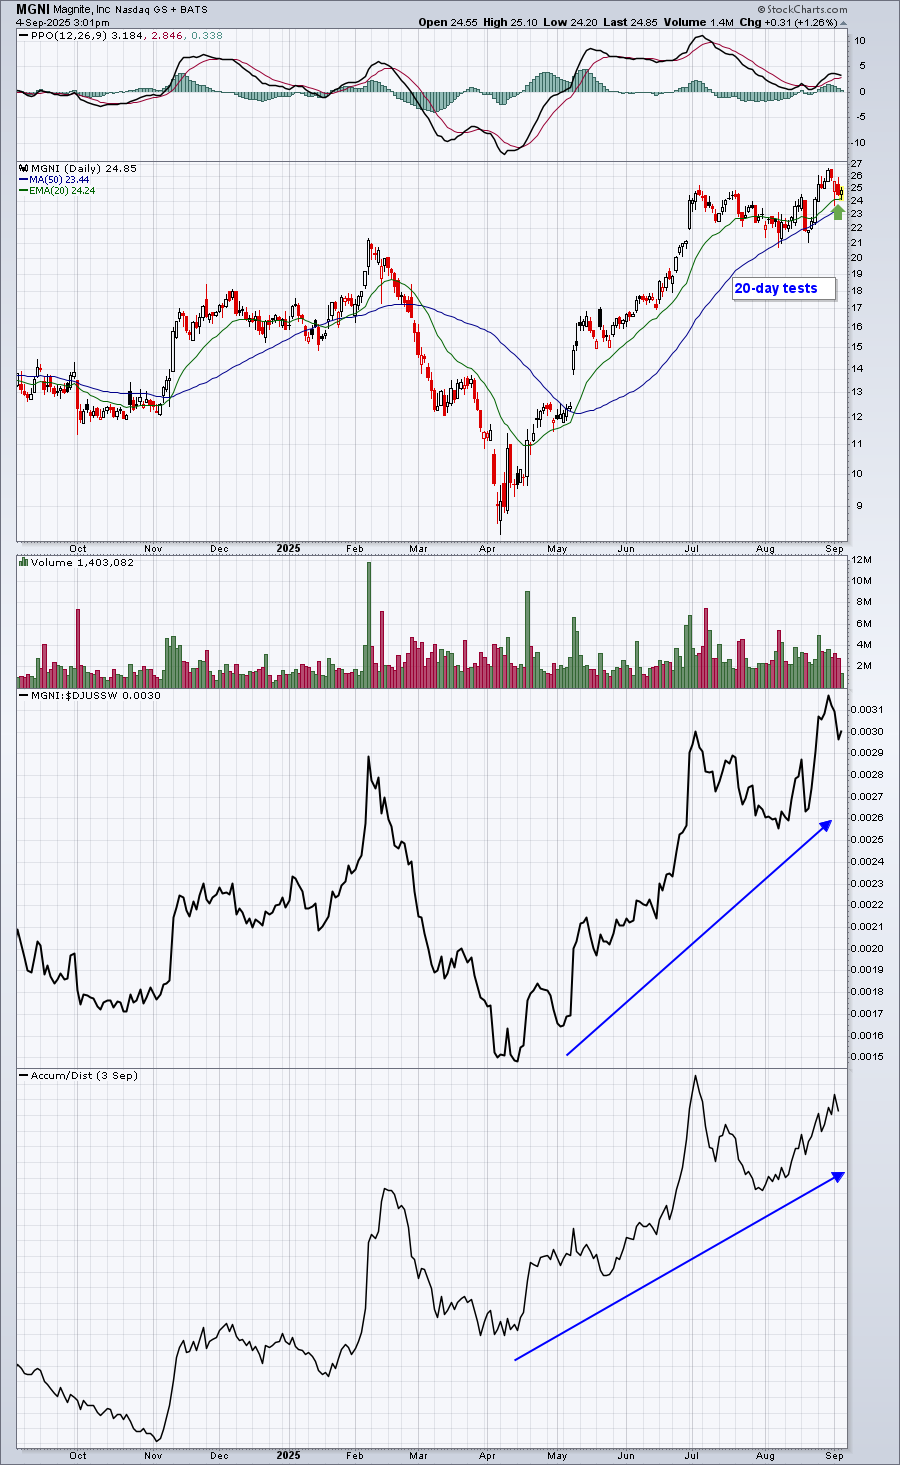
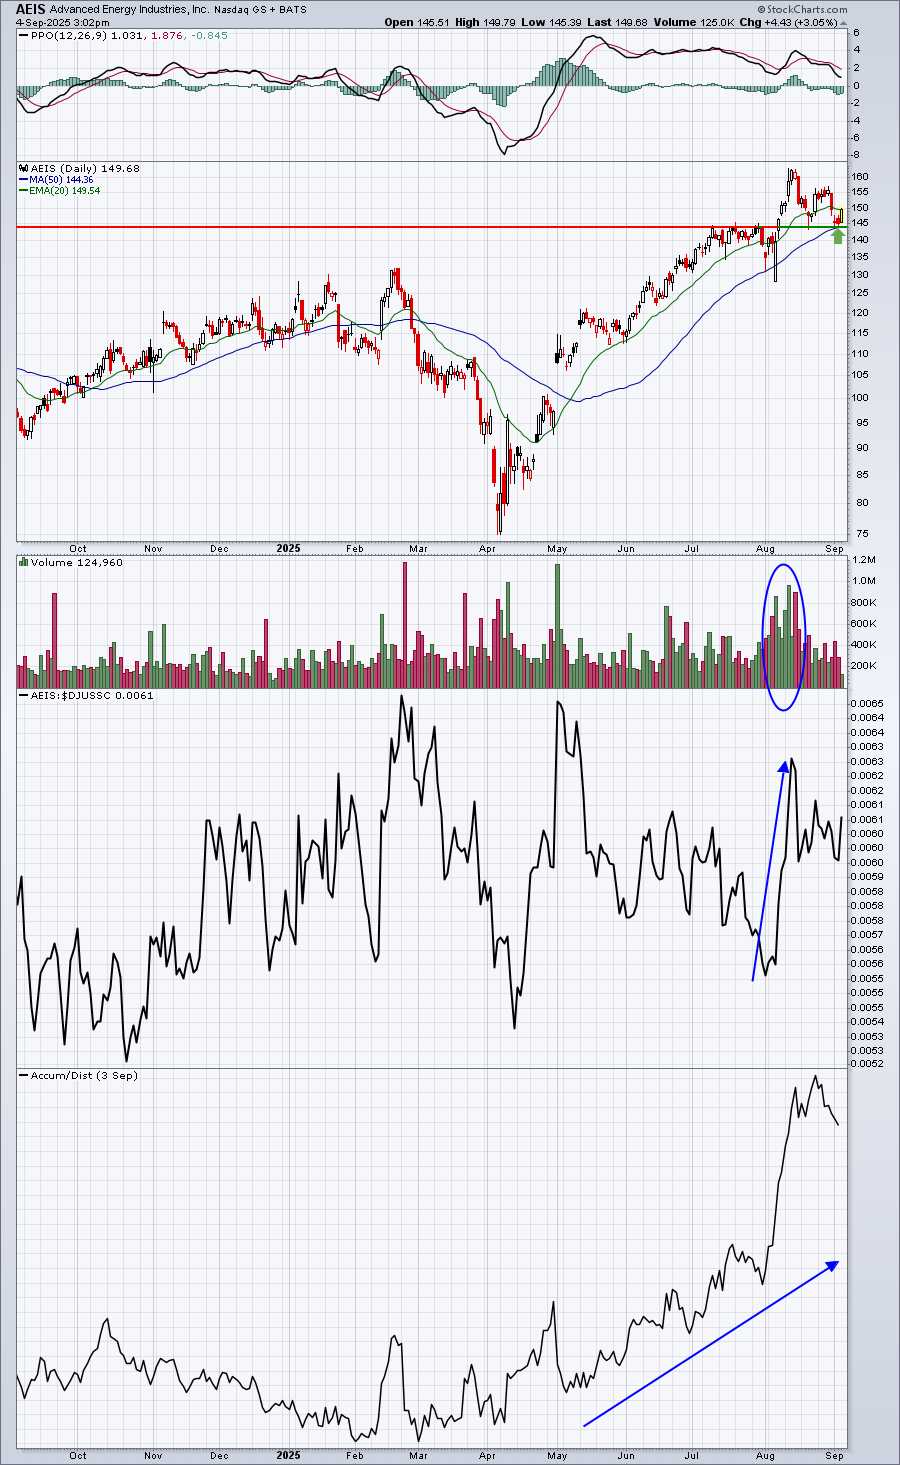
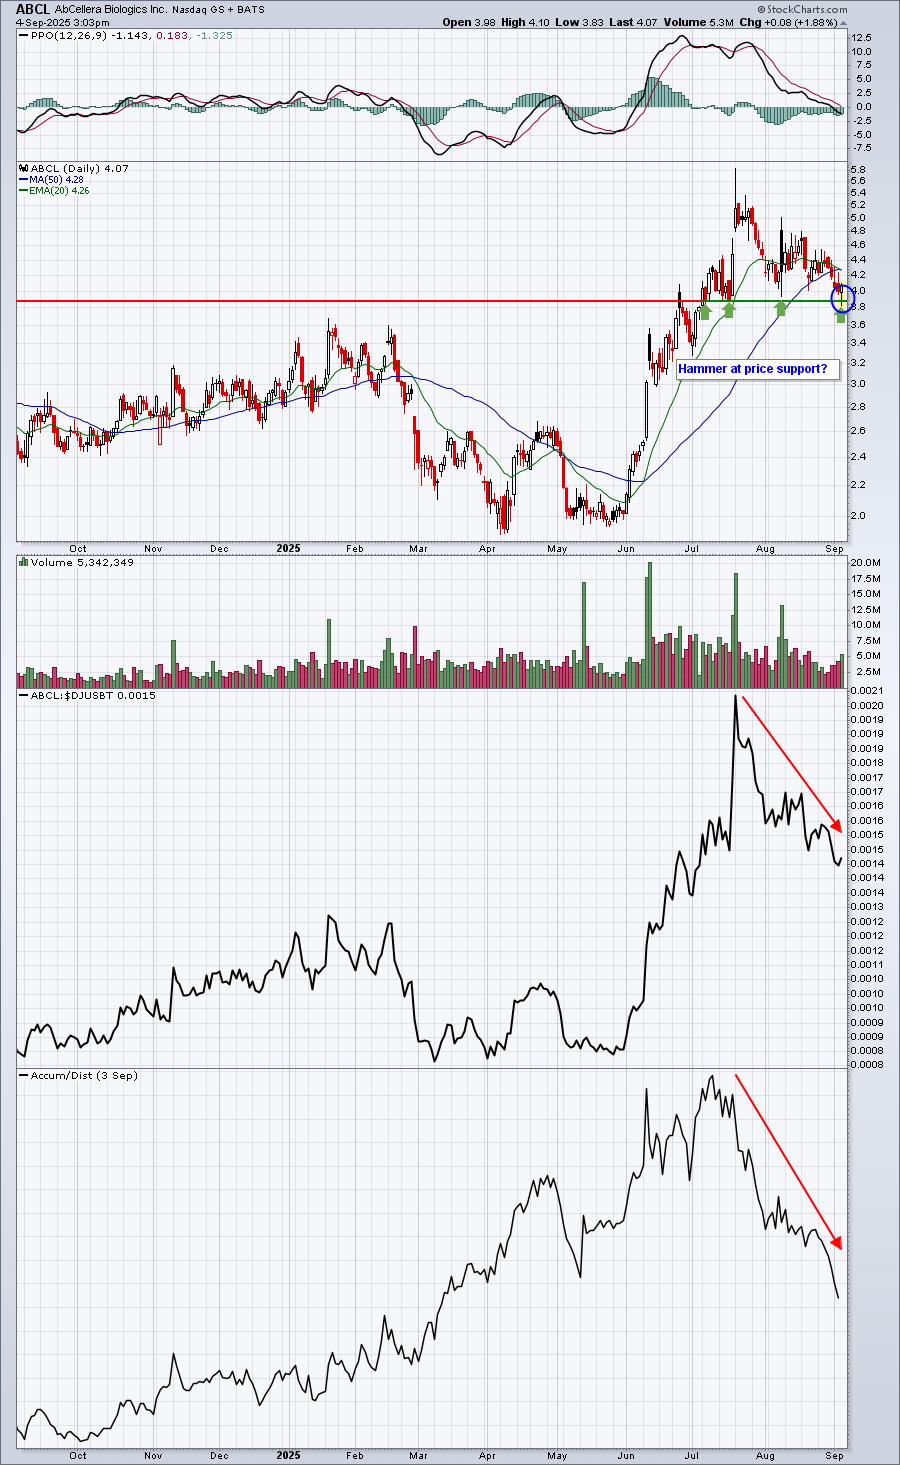
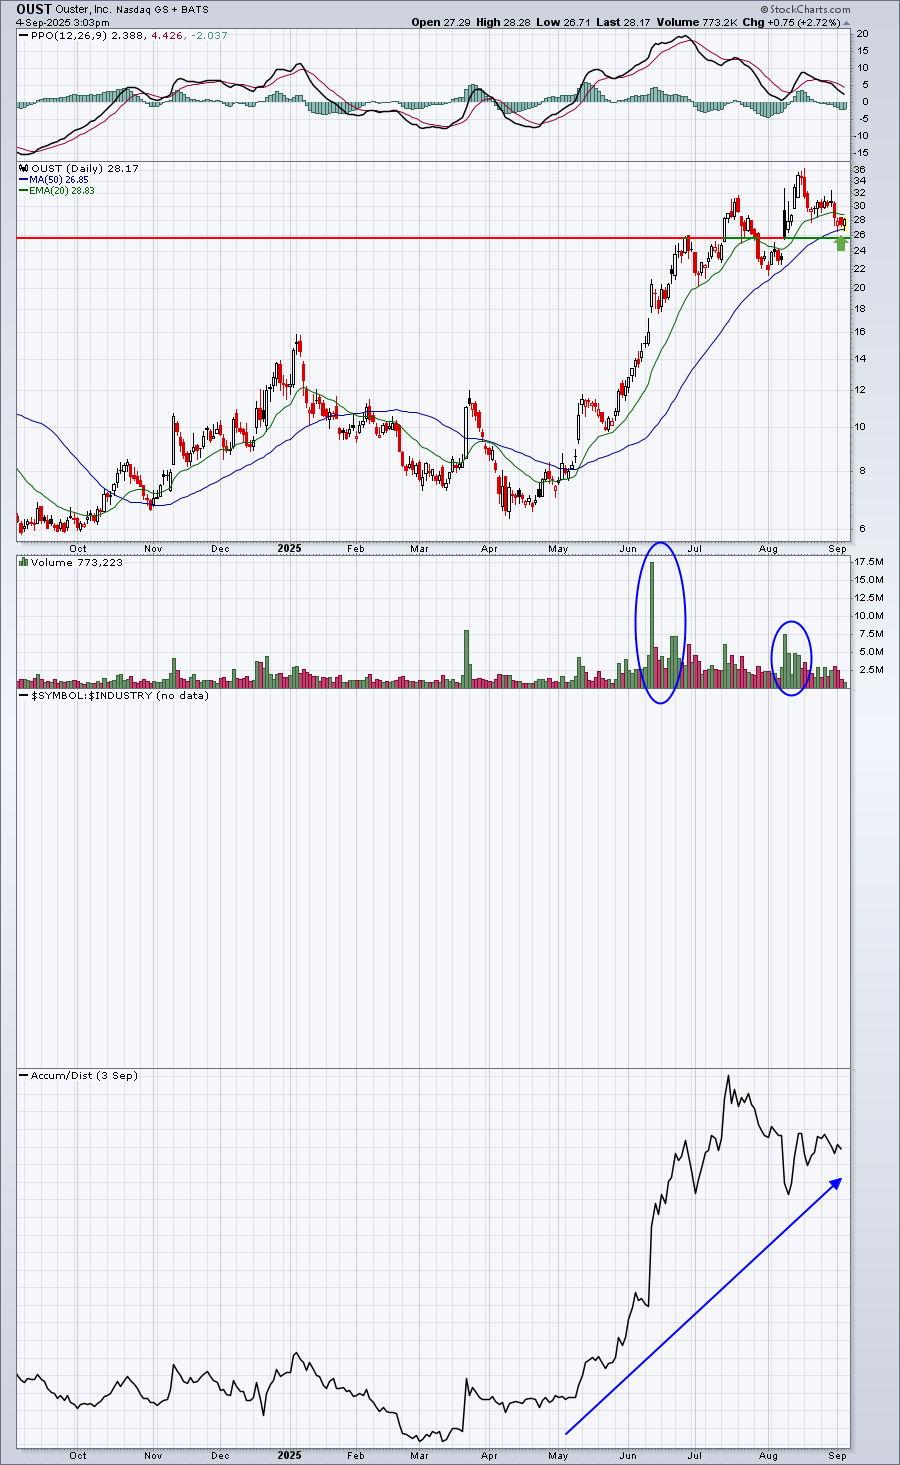
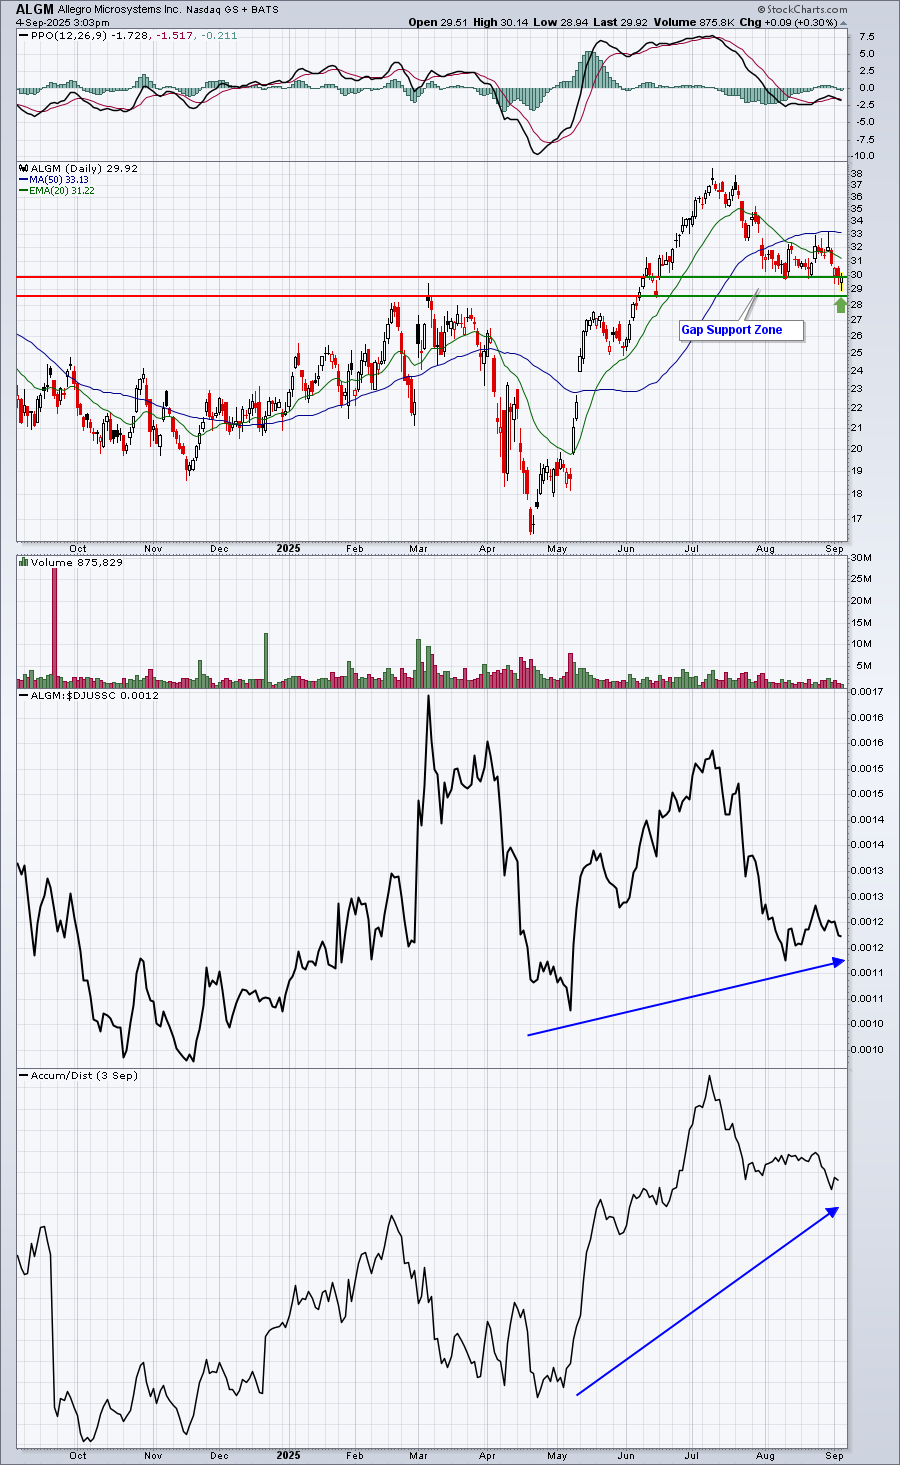
The Small Cap Top 25 ChartList that we provided members back in June continues to perform exceptionally well and I find the ChartList extremely helpful in terms of finding small cap stocks at or nearing key price support. Here are several examples just in the past couple days:
MGNI
AEIS
ABCL
OUST
ALGM
Upcoming Earnings
Earnings have slowed down, so we're no longer tracking the daily Upcoming Earnings and the Weekly Upcoming Earnings Relative Strength ChartLists. We will resume those ChartLists when Q3 earnings kick off in mid-October.
Economic Reports
August ADP employment report: 54,000 (actual) vs. 68,000 (estimate)
Initial jobless claims: 237,000 (actual) vs. 232,000 (estimate)
Q2 productivity: 3.3% (actual) vs. 2.5% (estimate)
Q2 unit labor costs: 1.0% (actual) vs. 1.6% (estimate)
August PMI composite: 54.6 (actual) vs. 55.4 (estimate)
August ISM services: 52.0 (actual) vs. 50.5 (estimate)
Happy trading!
Tom