
EB Daily Market Report - Tuesday, September 23, 2025
Executive Summary
- Futures were relatively flat overnight, then strengthened slightly as our major indices opened mixed
- The small cap Russell 2000 (IWM, +0.77%) is showing relative strength today as the growth trade cools
- Large cap growth (IWF, -0.58%) lags large cap value (IWD, +0.42%) for the first time in four trading sessions
- Energy (XLE, +2.37%) is showing leadership as crude oil ($WTIC, +2.44%) has spiked near $64 per barrel
- Meanwhile, the aggressive consumer discretionary (XLY, -0.57%) and technology (XLK, -0.40%) sectors are suffering from today's rotation
- Other commodities like gold ($GOLD, +0.96%) and silver ($SILVER, +0.75%) are gaining as traders mull the dollar's ($USD, +0.05%) recent retreat a near 4-year low
- The Volatility Index ($VIX, +1.24%) has been rising the past few days, despite U.S. equities setting all-time highs each day - this is a short-term warning sign, more on this below
- Electrical components ($DJUSEC, -1.99%), heavy construction ($DJUSHV, -1.91%), and broadline retailers ($DJUSRB, -1.85%) are having notably weak days among key industry groups
Market Outlook
I mentioned the rising VIX above and it's always noteworthy when the VIX moves in the same direction as the S&P 500 for a period of time. Normally, the VIX and S&P 500 move in opposite directions and that can be clearly visualized by comparing the VIX and SPX using the correlation coefficient (bottom panel):
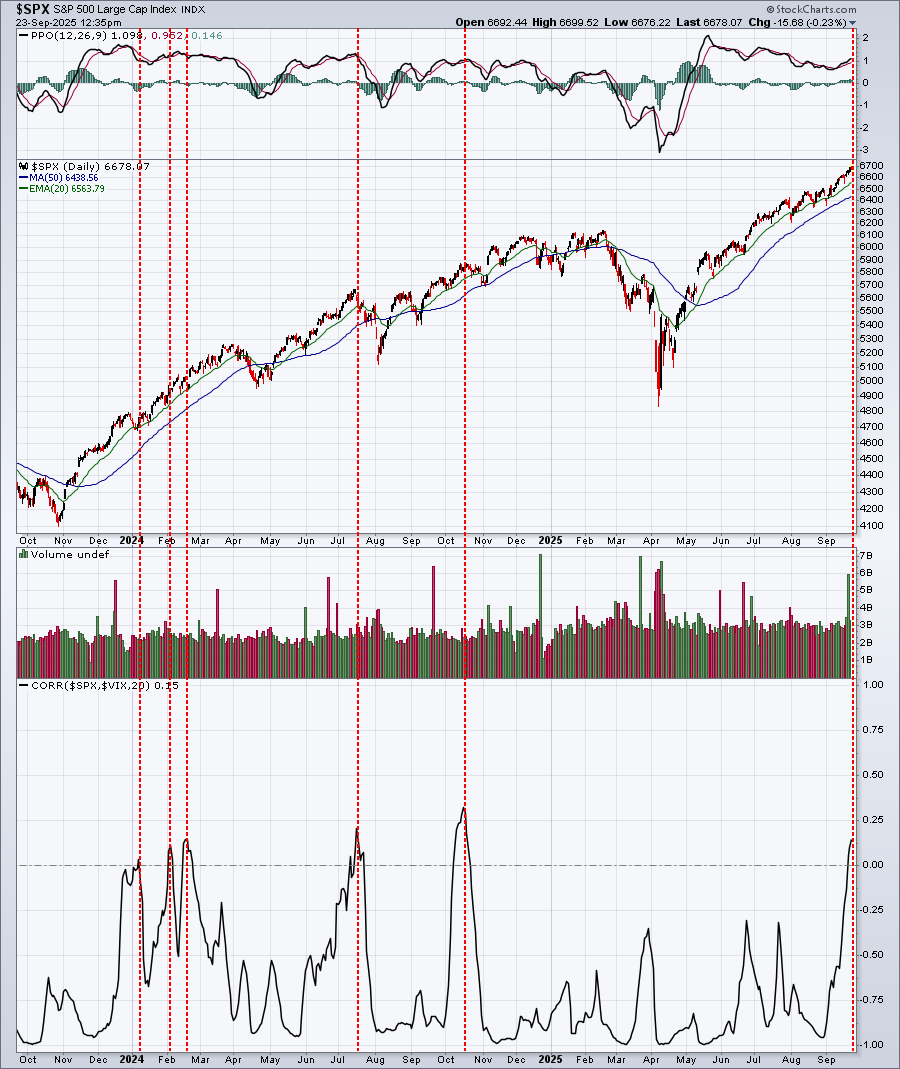
The last two times we've seen this development (correlation rising above zero), we've seen a subsequent selloff - though short-lived. While market participants have ignored the historically-weak 2nd half of September thus far, seeing sentiment issues building adds another layer of potential short-term bearishness to our forecast. These issues, if they do play out, tend to do so over a very quick time frame, many times over no more than a few days to a week. This is NOT a long-term concern, but it is adding additional risk to the current market environment that's worth mentioning.
In the Weekly Market Report that I published yesterday, I discussed another short-term sentiment issue - the 5-day SMA of the equity only put call ratio ($CPCE). These are two separate and distinct warnings at a time when we typically see market weakness (September 20-26 is the 2nd worst week of the year historically since 1950). Personally, as a short-term trader, I've chosen to lighten my portfolio load, moving a bit more to cash. Again, I want to emphasize that I don't see anything that concerns me longer-term and we may not see any weakness at all. I just like to protect capital a bit when I begin to see multiple short-term warning signs.
Sectors/Industries
One industry group that I mentioned above that's struggling today is electrical components ($DJUSEC). First, it's important to note that the DJUSEC is in a VERY bullish cup right now, so any short-term weakness here will likely print a handle and set up a buying opportunity in many of its component stocks. Check out this chart:
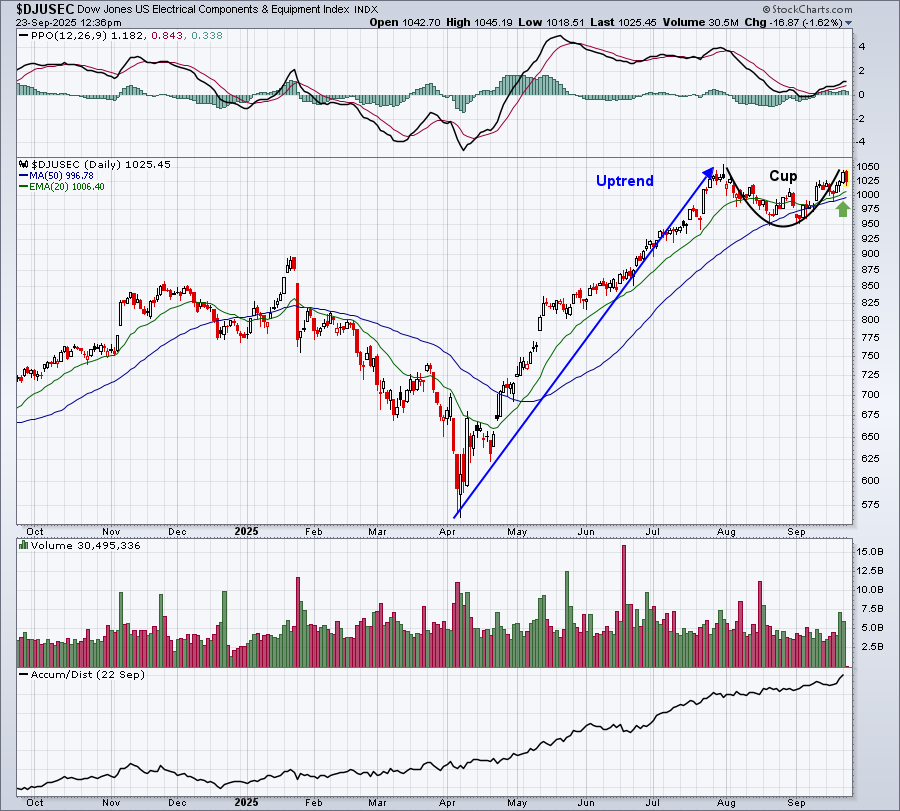
I love this group and look at a moving average test and handle as a solid entry point into the space. So....if we do see a brief period of selling, areas like electrical components will look very, very interesting. If you're wondering the best way to take advantage of a pullback in this group, consider that our Strong Earnings ChartList (SECL) currently features 9 companies in this space. Ranked in SCTR (StockCharts Technical Rank) order, they are CLS, AMSC, TTMI, COMM, APH, FELX, TEL, DAKT, SANM. On the Raised Guidance ChartList (RGCL), there are 16 companies in this industry group.
ChartLists and Trading Strategies
While I am personally holding off on adding any new positions at the moment, that doesn't mean that setups aren't out there. I'm simply taking the stance that I want less risk right now, not more.
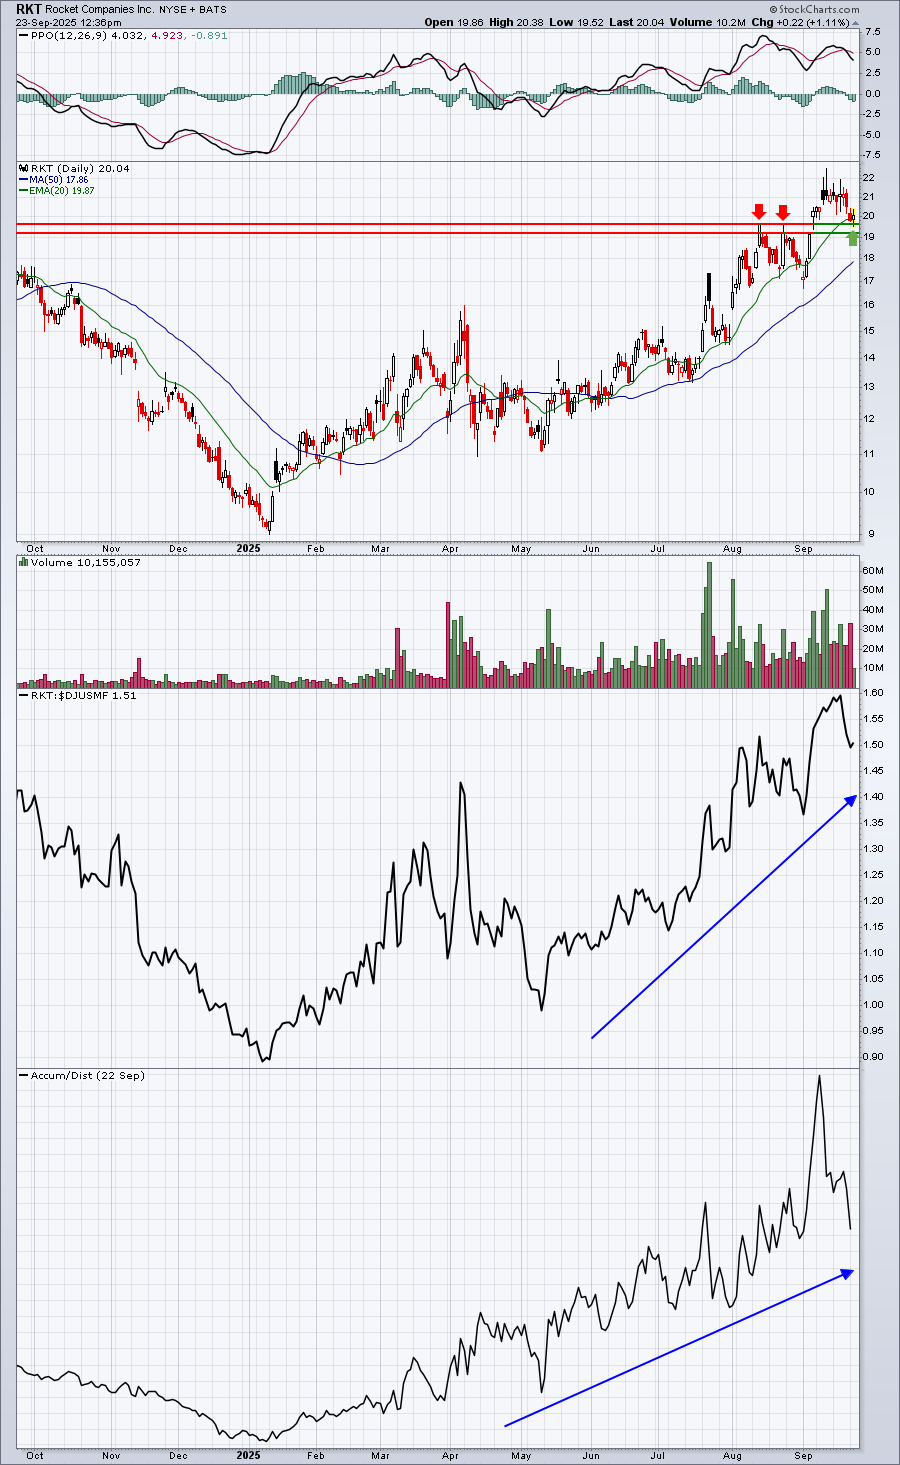
We could see this secular bull market put its head down and continue to trade higher. That is an absolute possibility. If you want to keep a risk-on mindset, I honestly cannot blame you. Many opportunities exist on our various ChartLists. I love to find stocks with excellent setups on our Strong Earnings (SECL) and Raised Guidance (RGCL) ChartLists, but the Leading Stocks in Leading Industries ChartList (LSCL) is a great place for high-octane, momentum traders to look as well. The Bullish Trifecta ChartList (BTCL) houses many of the best technically- and fundamentally-sound companies in the market. Rocket Companies (RKT) is on our BTCL and has recently dropped over 10% to test both price support and the rising 20-day EMA. While it provides us no guarantee of success, the recent pullback has created a much better reward-to-risk trading opportunity:
Also, focusing on areas just now showing strength and making key breakouts could be a better alternative than chasing performance in areas of the market that have already made significant advances. For instance, Haliburton (HAL) has struggled to clear key price resistance slightly above 23 for months.....until today:
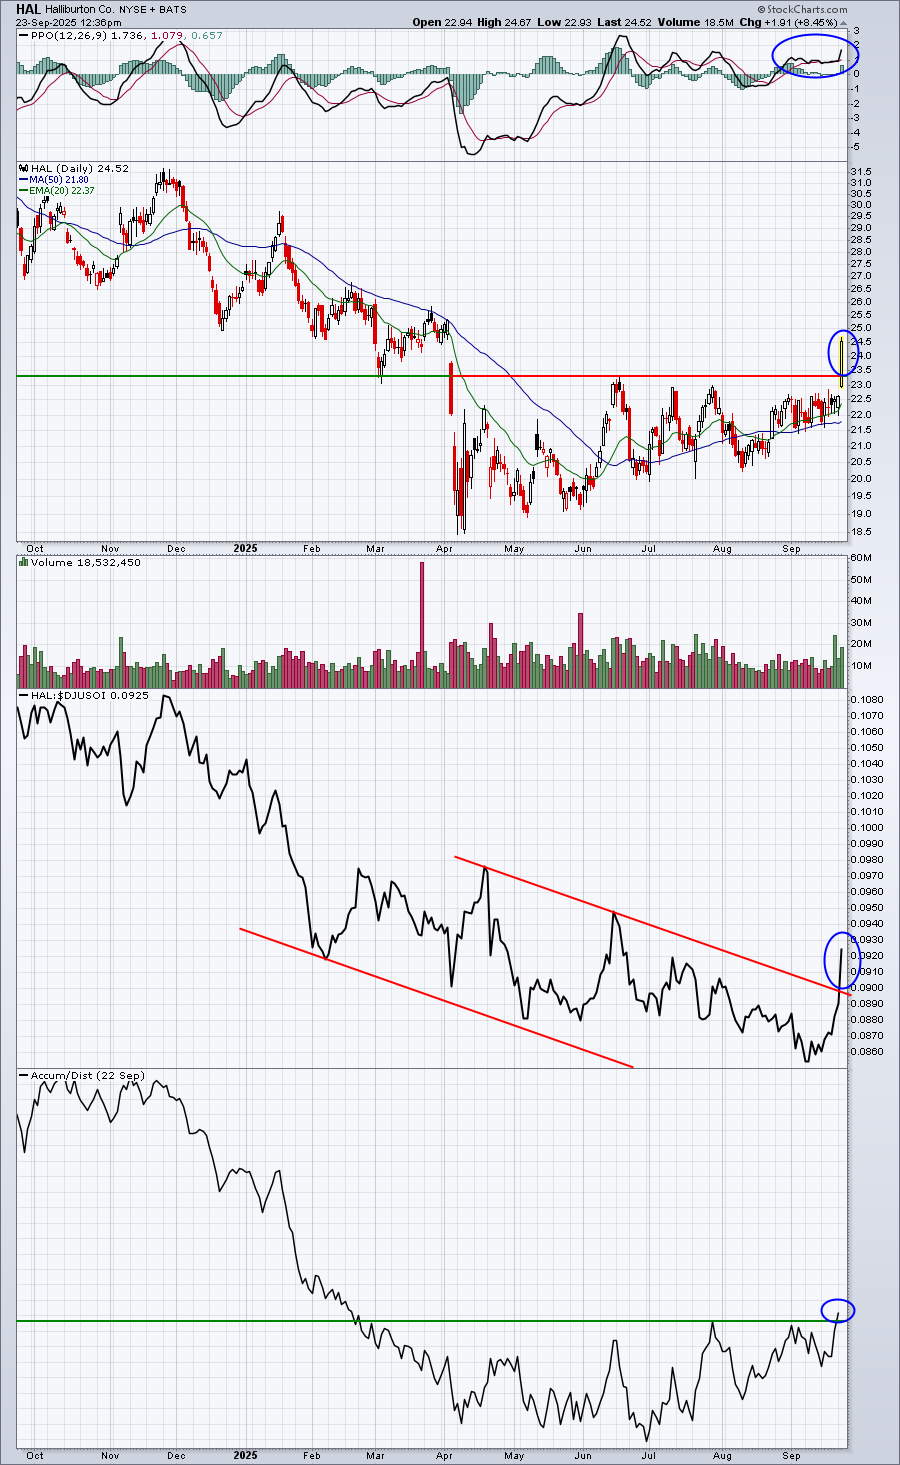
I see a lot of improvement on the HAL chart and while calling a major advance here could be premature, one thing's for certain. You can't get a long-term advance without first starting the advance by breaking through key resistance. Step 1 has been achieved.
Upcoming Earnings
We're not currently tracking the daily Upcoming Earnings and the Weekly Upcoming Earnings Relative Strength ChartLists as few companies report this time of the quarter. We will resume these ChartLists when Q3 earnings kick off in mid-October.
Economic Reports
None
Happy trading!
Tom