
EB Daily Market Report - Wednesday, October 1, 2025
Executive Summary
- Futures were lower overnight as the government shutdown took full effect
- We've since seen buying as the S&P 500 pushes above and tries to close above 6700 for the first time in history
- Strength today favors large-cap growth (IWF +0.70%) over large-cap value (IWD, +0.13%)
- The ADP employment report came in negative for September and its August revision was also negative, yet U.S. equities have shaken it off
- The 10-year treasury yield ($TNX) has fallen 4 basis points back to 4.10% on the heels of the weak ADP employment report
- The defensive health care sector (XLV, +3.03%) is having a huge day and the S&P 500 leaderboard is littered with health care stocks like BIIB, LLY, MRNA, MRK, and REGN, all of which have gained more than 7.5%
- Cryptocurrencies are higher on the government shutdown, led by solana ($SOLUSD, +5.24%)
- Crude oil prices ($WTIC, -0.88%) are taking another hit, this time below $62 per barrel; energy (XLE, -0.14%) is down in sympathy
- Materials (XLB, -0.96%) is today's worst-performing sector, followed closely by communication services (XLC, -0.93%)
- Nike (NKE, +6.20%) is surging after reporting better-than-expected quarterly earnings results
Market Outlook
I'm expecting to see lower interest rates ahead. Short-term interest rates will likely fall more quickly than longer-term rates. The short-term fed funds rate was cut by the Fed last month and the Fed has pointed to another 2 rate cuts into year end. That will likely cut the fed funds rate by another 50 basis points by December 31st. The 10-year treasury yield ($TNX) will probably fall, but not nearly as quickly as the fed funds rate. I expect there to be a bit more trepidation in the longer end of the yield curve due to inflation remaining slightly above the Fed's target of 2.0% for the foreseeable future.
The TNX did briefly head higher, as you can see from the chart below, but it was quickly rebuffed at key yield resistance. Check this out:
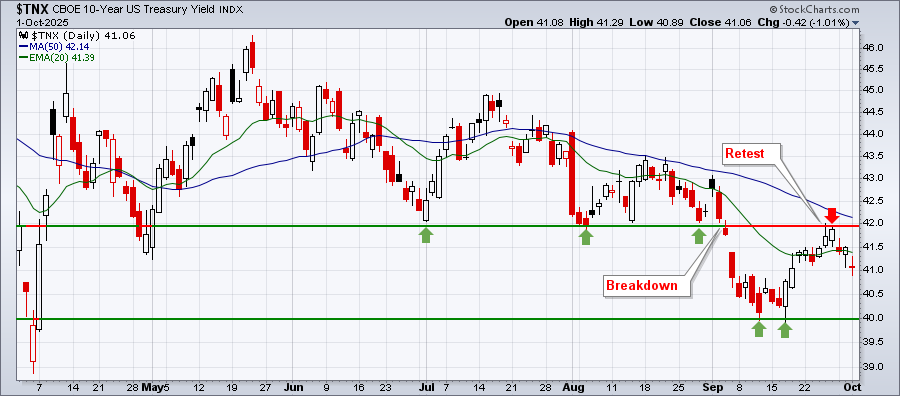
The 4.00% level is short-term support and I believe that's where the TNX is headed next. We're currently in a 4.00%-4.20% range on the TNX, though I expect the next break out of this range to be to the downside.
Sectors/Industries
Banks ($DJUSBK) are the worst-performing industry group within financials (XLF) today, but I continue to love the group and I'm personally building a large position in the diversified regional bank ETF (KRE). I'm of the opinion that a lower fed funds rate will reduce borrowing costs among small to midsize banks, while a slower-falling TNX will increase the net interest margin for many banks. I don't expect to see banks rise every day, but I do believe accumulation is taking place on this group, as evidenced by recent early-morning weakness, followed by afternoon strength. Look at this 5-day 10-minute chart:
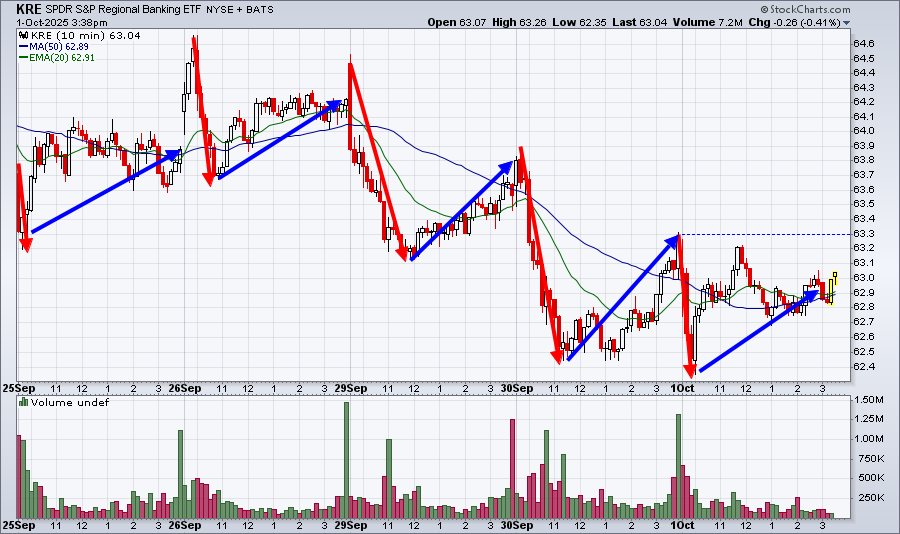
While small caps and regional banks have been lagging the large cap indices the past few days, I'm seeing what appears to me to be solid accumulation after early-morning selling occurs. On the daily chart, the KRE has been falling each day, but the AD line is actually rising slowly:
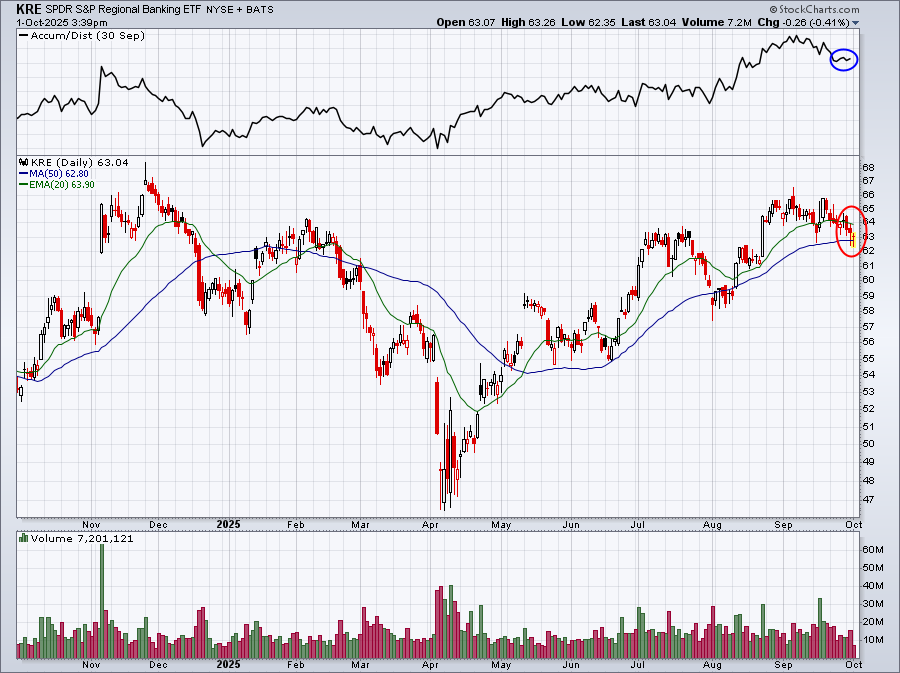
While down is down, in terms of price, I believe there are "better" looks on a downtrending chart and the KRE appears to have that "better" look. This provides us no guarantees, but I'm going to be very surprised if this regional banking group doesn't post a very solid October ahead.
ChartLists and Trading Strategies
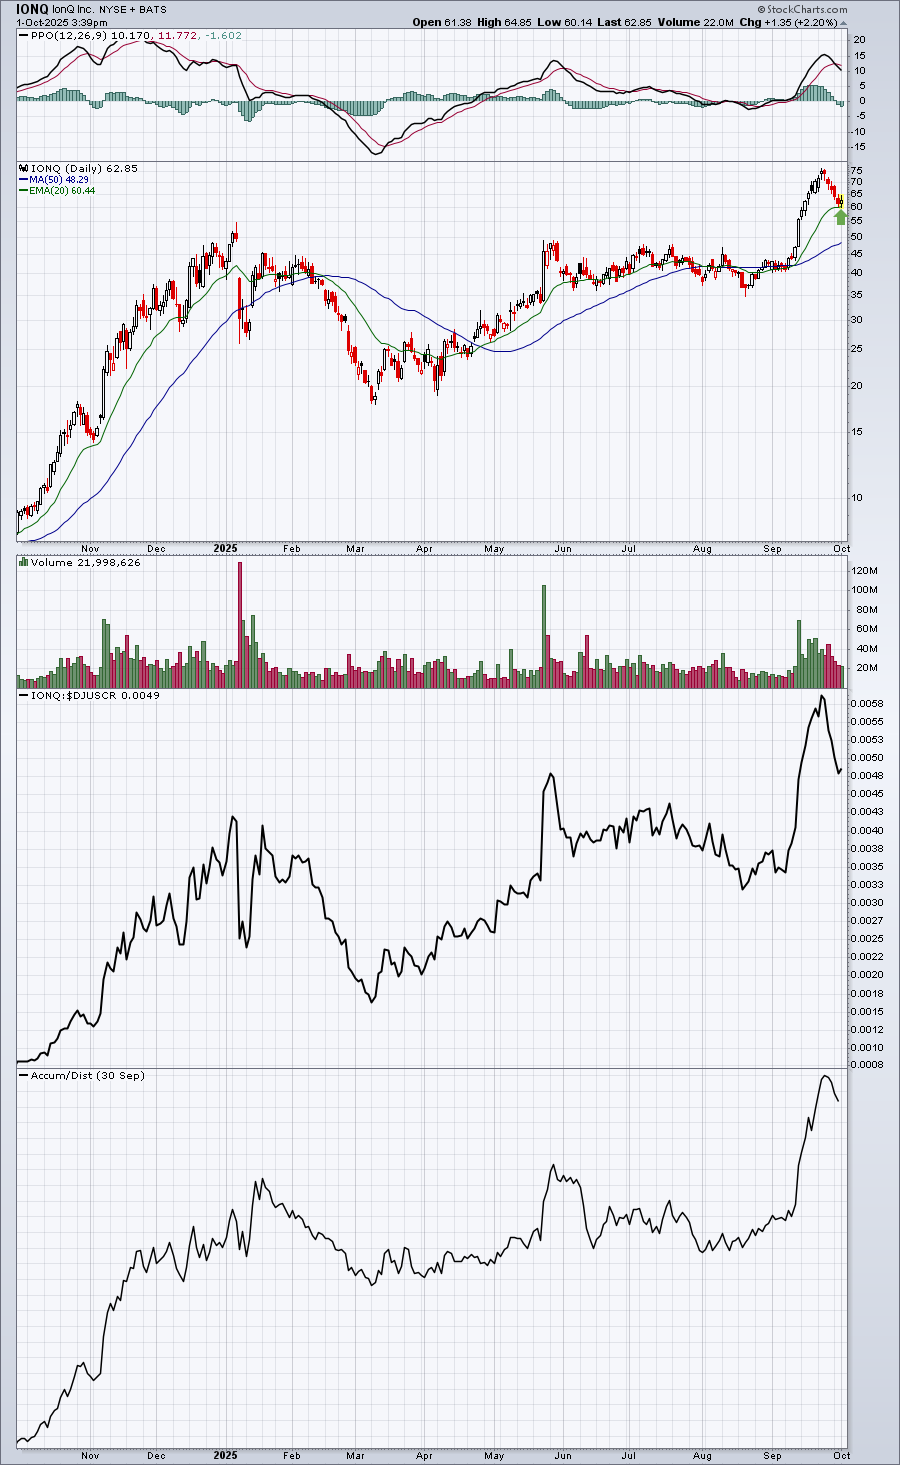
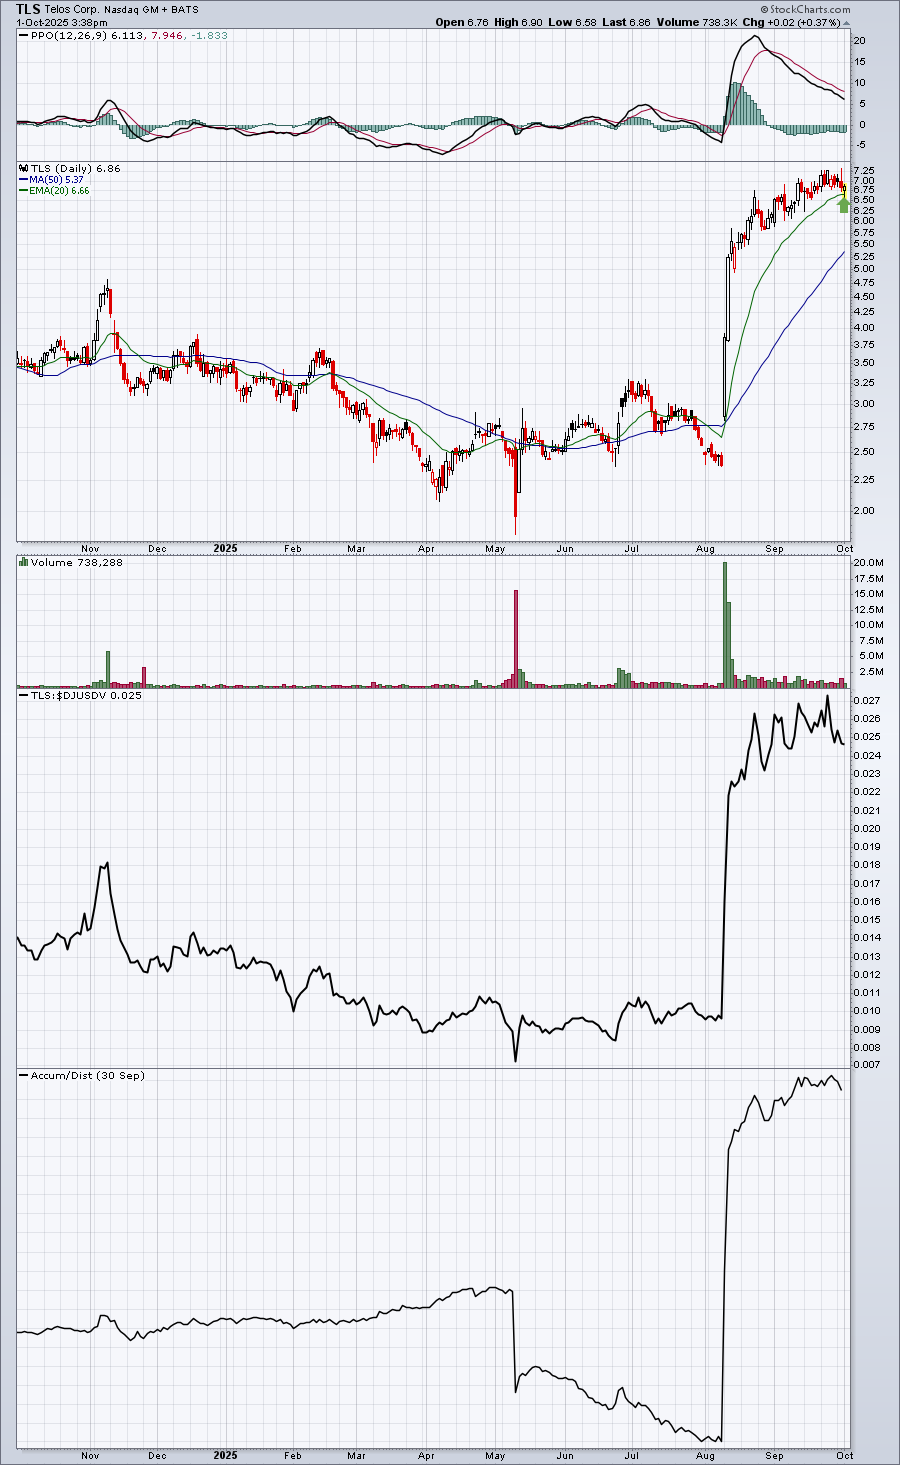
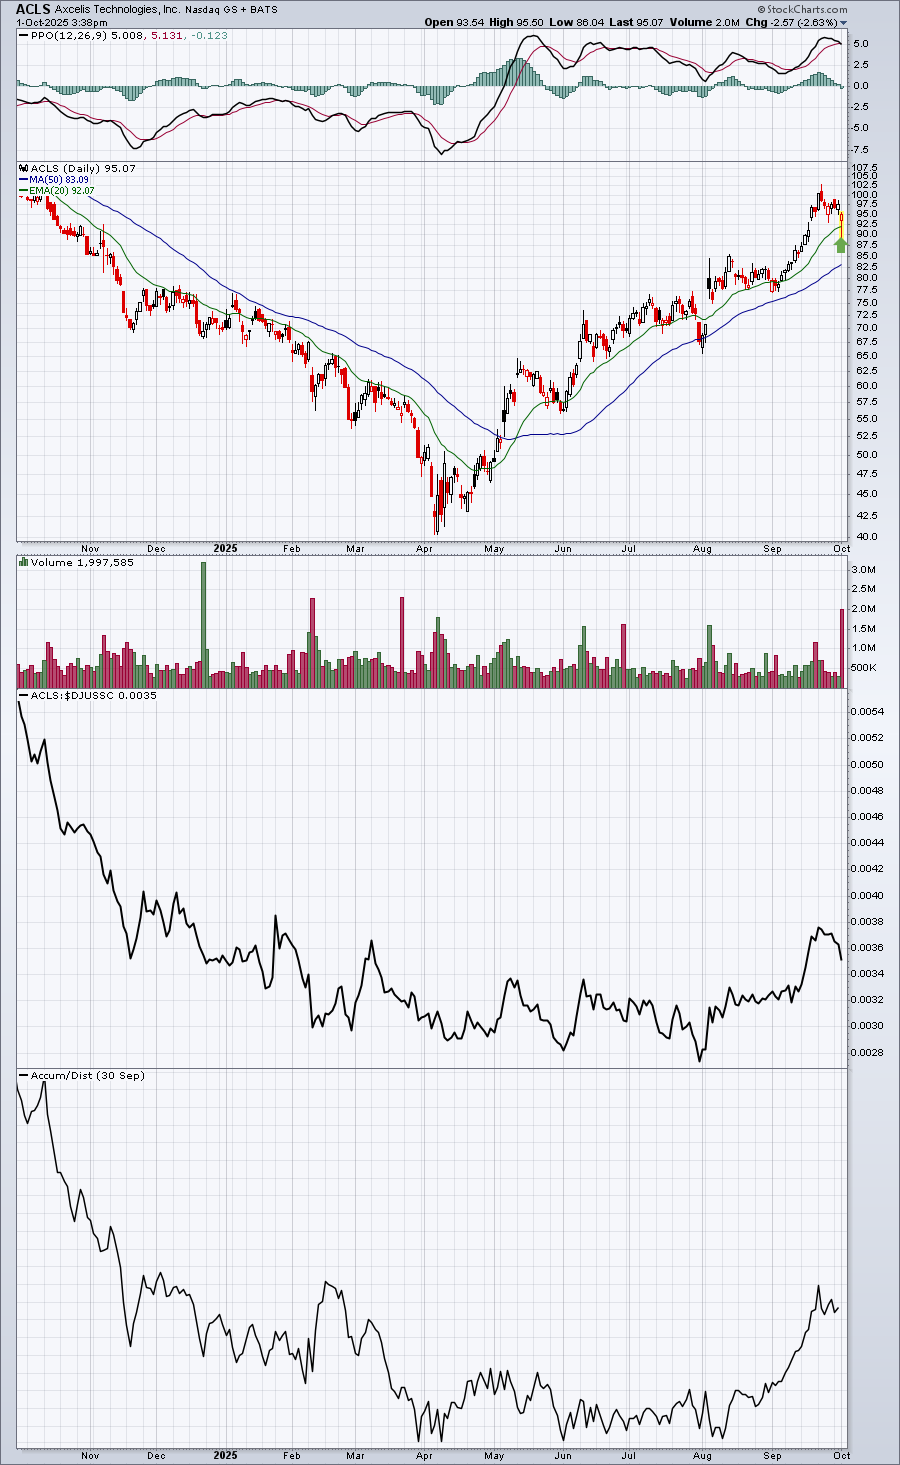
I ran our 20-day EMA scan on our website against two ChartLists - the Strong Earnings (SECL) and the Raised Guidance (RGCL). 32 stocks were returned. Here are 4 of these 32 stocks that have shown weakness over the past week or so, leading to key 20-day EMA tests:
IONQ:
TLS:
ACLS:
STNE:
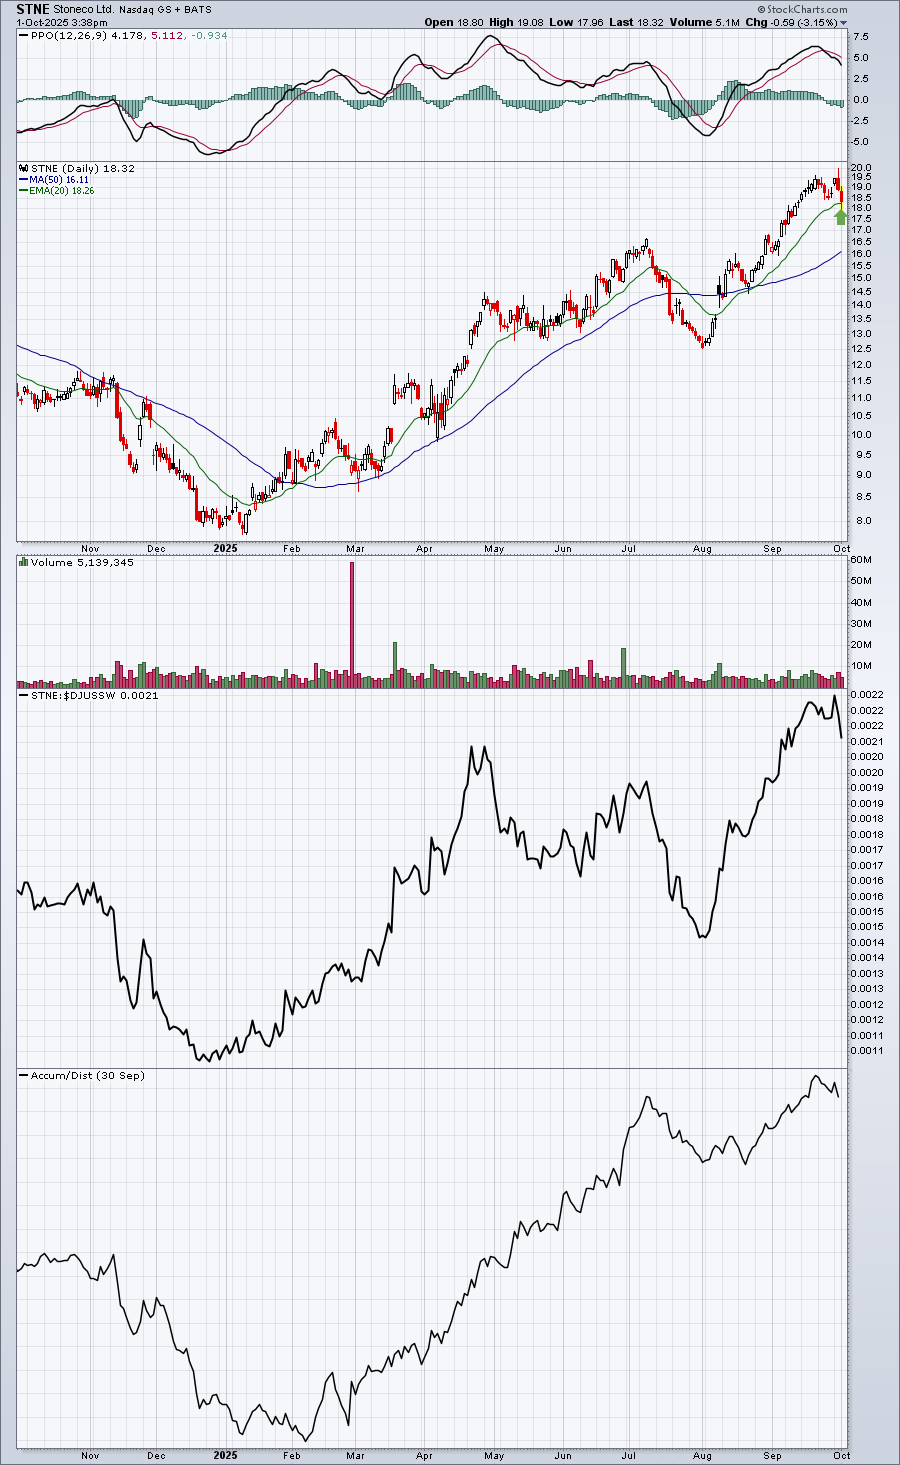
I have found in my experience that 20-day EMAs provide excellent support for short-term trades. And if you decide to enter and the stock fails to hold its 20-day EMA, you can exit with minimal damage/loss. Recent highs would mark potential targets for profit. It's a simply, yet effective trading strategy that I've employed for years.
Upcoming Earnings
We're not currently tracking the daily Upcoming Earnings and the Weekly Upcoming Earnings Relative Strength ChartLists as few companies report this time of the quarter. We will resume these ChartLists when Q3 earnings kick off in mid-October.
Economic Reports
September ADP employment report: -32,000 (actual) vs. 50,000 (estimate)
August ADP employment report: -3,000 (revised) vs. 54,000 (prior)
September PMI manufacturing: 52.0 (actual) vs. 52.0 (estimate)
September ISM manufacturing: 49.1 (actual) vs. 49.0 (estimate)
Happy trading!
Tom