
EB Daily Market Report - Wednesday, October 8, 2025
Executive Summary
- Futures were up overnight and our major indices did gap higher at the opening bell today
- Cryptocurrencies are higher as the recent winning streak in the U.S. Dollar (UUP) continues
- Commodities are mostly higher as gold ($GOLD, +1.60%) surges again, following its first close ever above $4000 per ounce
- Crude oil ($WTIC, +1.38%) is jumping back above $62 per barrel, though the impact on energy shares (XLE, -0.62%) isn't what I'd expect
- Technology (XLK, +1.46%) and industrials (XLI, +0.74%) are leading all S&P 500 sectors
- Sector performance is bifurcated, however, as 5 sectors trade lower, led by the aforementioned XLE
- Advanced Micro Devices (AMD, +9.94%) is breaking out once again, leading a red-hot semiconductor group ($DJUSSC, +2.23%)
- Earnings season is creeping closer; JP Morgan (JPM), Goldman Sachs (GS), and other large financials will get things started on Tuesday morning
Market Outlook
One of my boldest calls for 2025 was my expectation that the small cap Russell 2000 (IWM) would outperform the S&P 500 (SPY) and I've doubled down on that call recently as the Federal Reserve embarks on another interest-rate-cutting campaign. Last week, I highlighted a key area of relative support on the IWM:SPY, so I thought I'd provide the latest update of that chart:
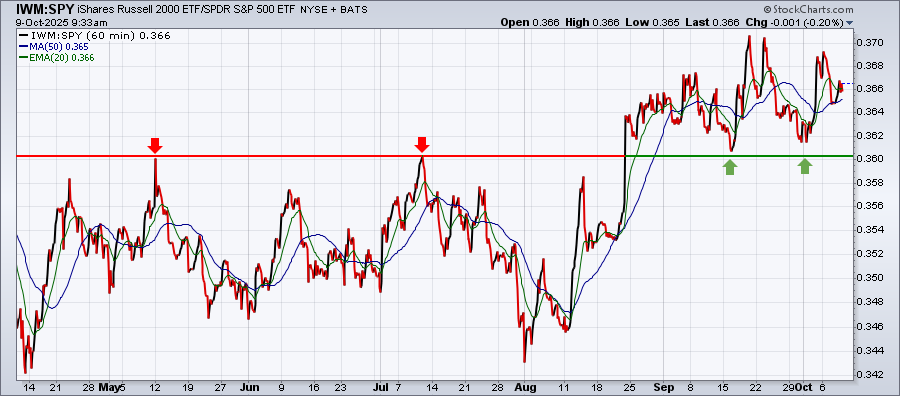
We haven't broken out on a relative basis, but the IWM did move up again over the past week on a relative basis.
I'm also expecting much absolute and relative strength from regional banks (KRE). The KRE and other rate-sensitive areas have cooled in recent sessions and there could be two possible explanations for it. First, market participants could be reserving judgment on these interest-rate sensitive areas during the current government shutdown. It seems that much of the relative strength dissipated about the time of the shutdown, so perhaps there's a story there that we should consider.
The second possibility is nothing more than a brief seasonal issue. Early October isn't a great period historically for any of our major indices, but there's definitely more historical weakness on the Russell 2000 through October 9th (tomorrow). Perhaps once we get this seasonal weakness behind us, the IWM will be better positioned to advance. If it doesn't, then the shutdown could be having more of an impact than we realize.
Sectors/Industries
Since October began and the government shutdown kicked in, mortgage finance ($DJUSMF) has trailed the S&P 500 by 9 percentage points, making it the worst-performing industry group month-to-date. The next four worst-performing industry groups all belong to the consumer discretionary sector. They are, in no particular order, footwear ($DJUSFT), automobiles ($DJUSAU), home construction ($DJUSHB), and durable household products ($DJUSHD), which have all trailed the S&P 500 by 5.5%-6.5% in just one week.
Clearly, a government shutdown could ultimately impact GDP, so the longer this shutdown lasts, the bigger the risk, in my opinion, that the economy could suffer. That seems to be the story of this past week's rotation - that Wall Street is exiting some areas that could be hurt by a lasting shutdown.
I don't believe the weakness has grown to a point where we should be overly bearish, however, and as I mentioned in today's Live Trading Room, there are a few reasons to at least be a bit more cautious right now. The 5-day SMA of the equity only put call ratio ($CPCE) remains quite low, or complacent, while there's now a significant positive correlation between the S&P 500 and the Volatility Index ($VIX). Both of these sentiment indicators point to a potential short-term market top.
Finally, yesterday the intraday rotation from the XLY to the XLP was noteworthy. It wasn't downright bearish, but it definitely was an eye opener. If we see further rotation of this nature, it could point to potential weakness ahead. Here's a 5-day intraday chart showing the rotation from the XLY to the XLP:
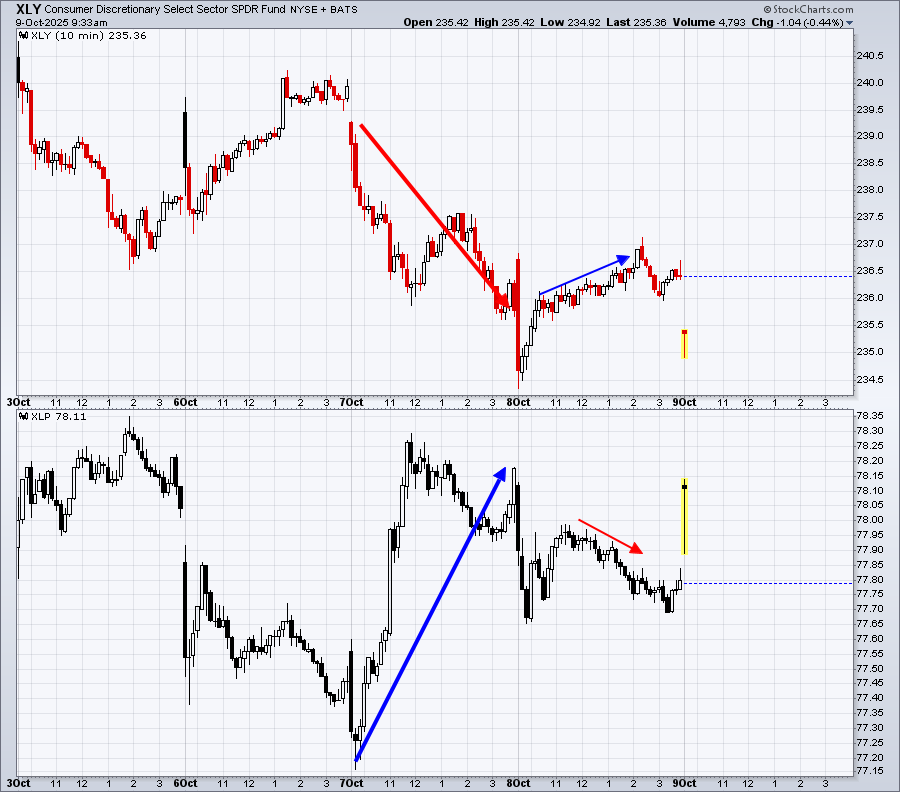
There were a number of other issues back in February when bearish rotation like this helped to mark the top in the S&P 500 before a significant pullback into March and April. The rotation itself was significantly less yesterday and what we saw back on February 21st. And today, money is moving back into discretionary, making yesterday's bearish rotation less bearish.
Still, I like to point out when unusual rotation takes place, especially if it continues and deepens. Fortunately, we're not seeing that for now.
ChartLists and Trading Strategies
The scans that I've been featuring lately right here in this section have been yielding excellent short-term results. Last Thursday, for instance, I discussed two possible scans and the 3 stocks that were returned in both scans were SOFI, DAVE, and EVLV. Since Thursday's close, SOFI, DAVE, and EVLV have returned roughly 8%, 5%, and 4%, respectively.
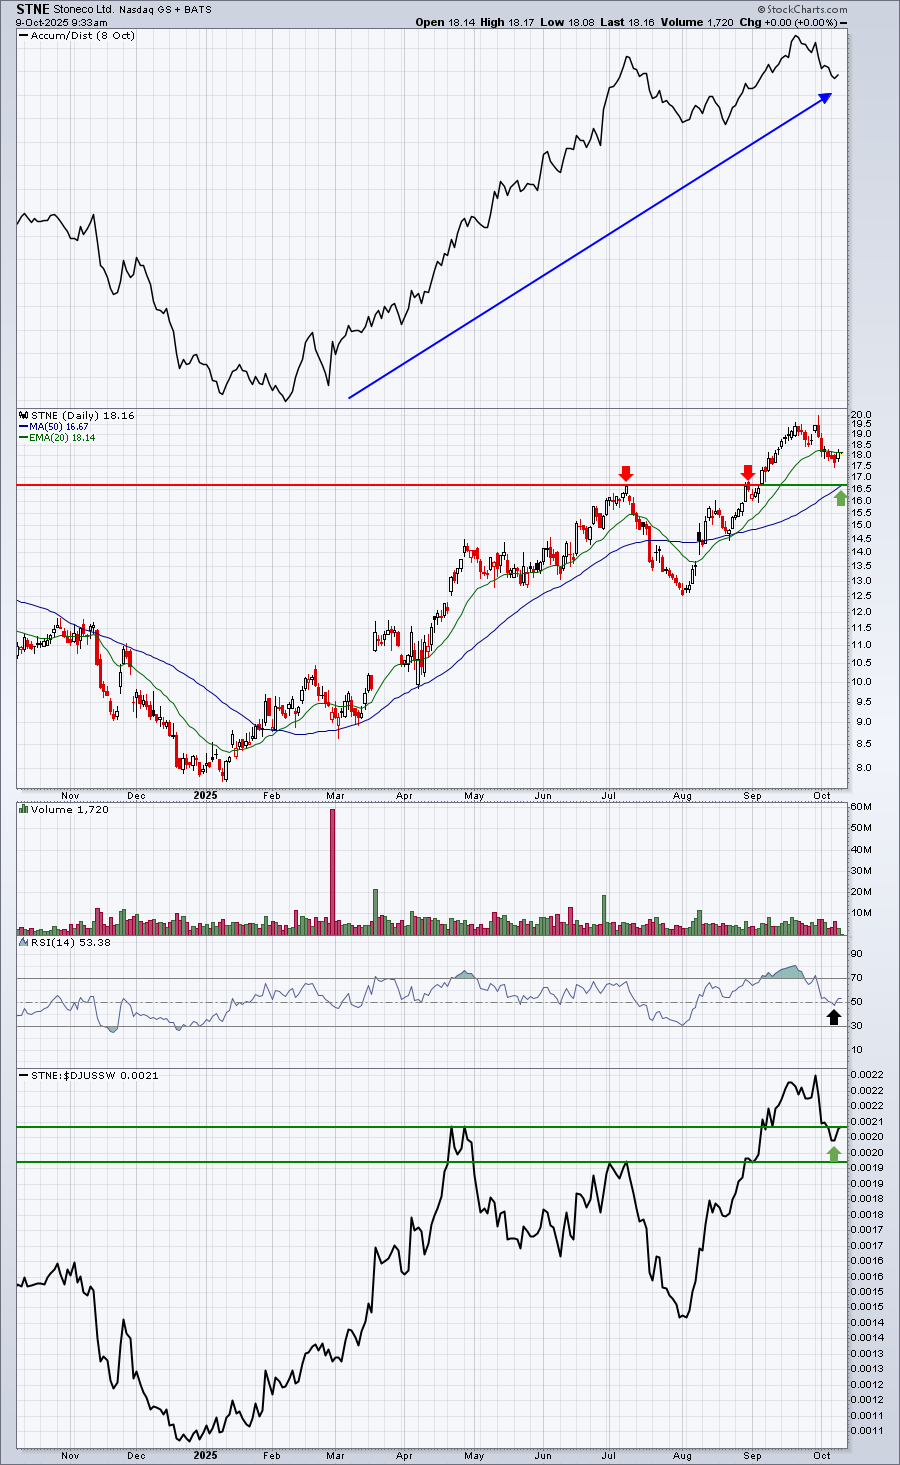
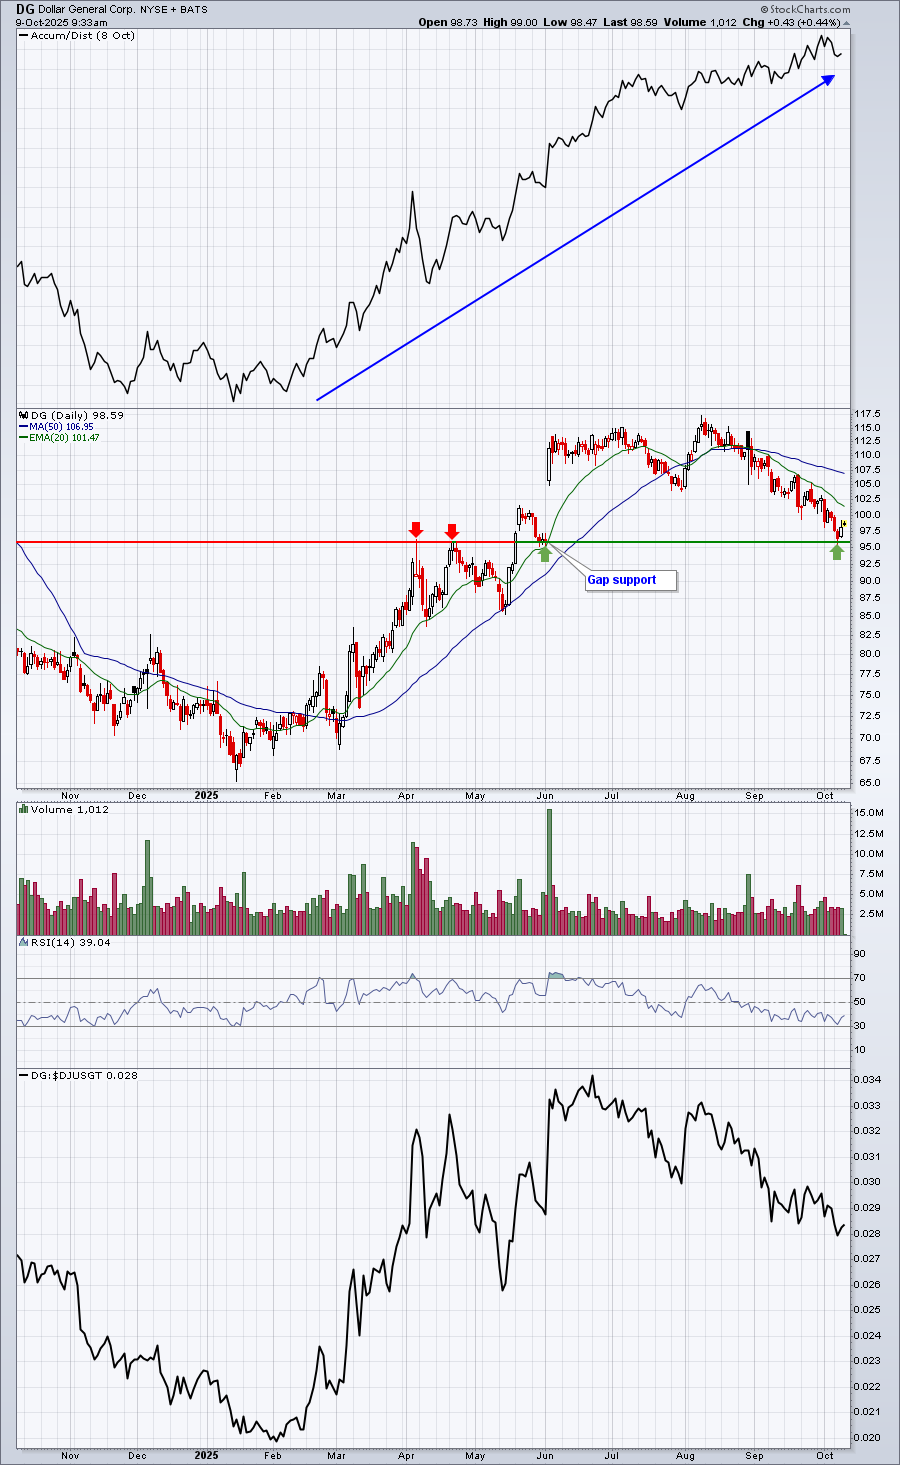
Another scan that I like to run is our Downtrend Reversal scan, which highlights any stock that is showing a higher intraday high today after showing lower intraday highs for the previous 5 or more trading sessions. It's an indication of a possible reversal. From the scan results, it's then time to look at the charts to see if a downtrend appears likely on the chart. Perhaps price is reversing at a key price support or moving average level.
I ran this Downtrend Reversal scan against our Strong Earnings ChartList (SECL) and Raised Guidance ChartList (RGCL) and the scan returned 14 trading candidates as follows (in SCTR order, highest to lowest):
RBLX, STNE, BLBD, DAKT, TILE, VREX, HTHT, CHWY, GL, HQY, DG, T, CXW, VIRT
I like RBLX, but I just discussed that one on Monday in my list of 10 stocks poised to make pre-earnings runs. Here are the other 2 that interest me the most from this scan:
STNE
DG
Upcoming Earnings
We will begin tracking the daily Upcoming Earnings and the Weekly Upcoming Earnings Relative Strength ChartLists for Q3 earnings this weekend, featuring many large financial companies that will report their quarterly results next week.
Economic Reports
Economic reports due out based on government data continue to be delayed, because of the U.S. government shutdown.
Happy trading!
Tom