
EB Daily Market Report - Wednesday, October 15, 2025
Executive Summary
- Futures were higher overnight and our major indices gapped up
- Throughout the first half of today's trading session, there was significant selling as our major indices turned negative
- We're rallying back this afternoon, however, with leadership once again centered on small cap stocks (IWM, +0.91%)
- 3 sectors are up more than 1% - real estate (XLRE, +1.54%), utilities (XLU, +1.38%), and technology (XLK, +1.05%)
- Industrials (XLI, -0.36%) are showing relative weakness, led lower by defense stocks ($DJUSDN, -2.62%)
- The 10-year treasury yield ($TNX) touched 4.00% again, before bouncing; the TNX is up 3 basis points to 4.05%
- Cryptocurrencies remain under pressure, while gold ($GOLD, +1.53%) hits another milestone, moving above the $4200 per ounce level for the first time ever
- Earnings are moving back into the spotlight with Bank of America (BAC, +4.44%) leading banks ($DJUSBK, +0.86%) higher
Market Outlook
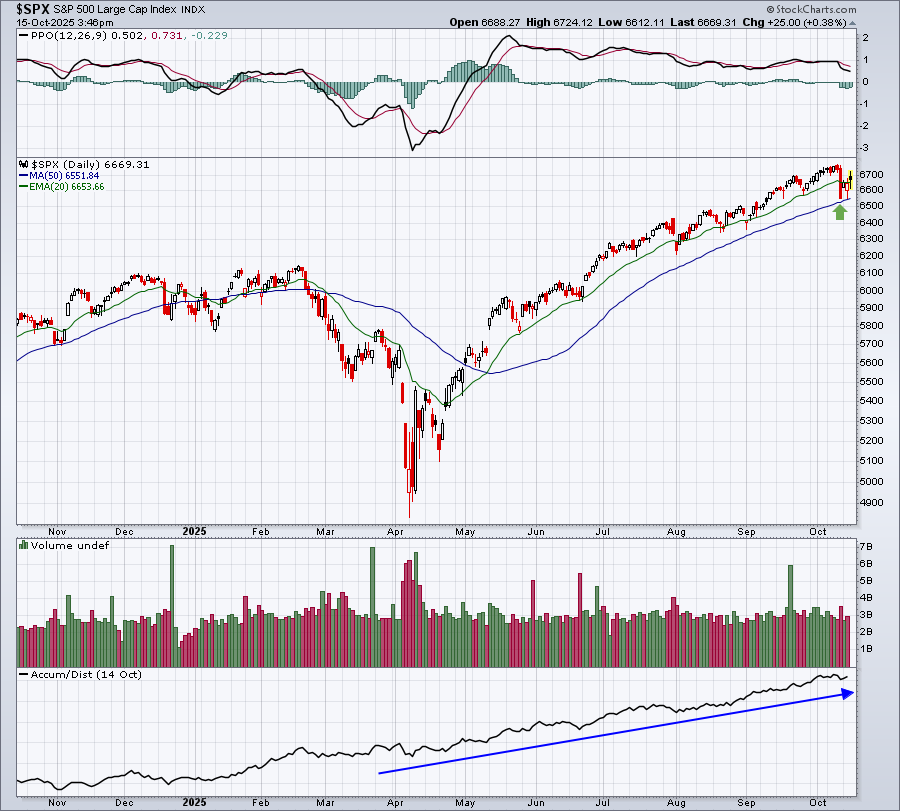
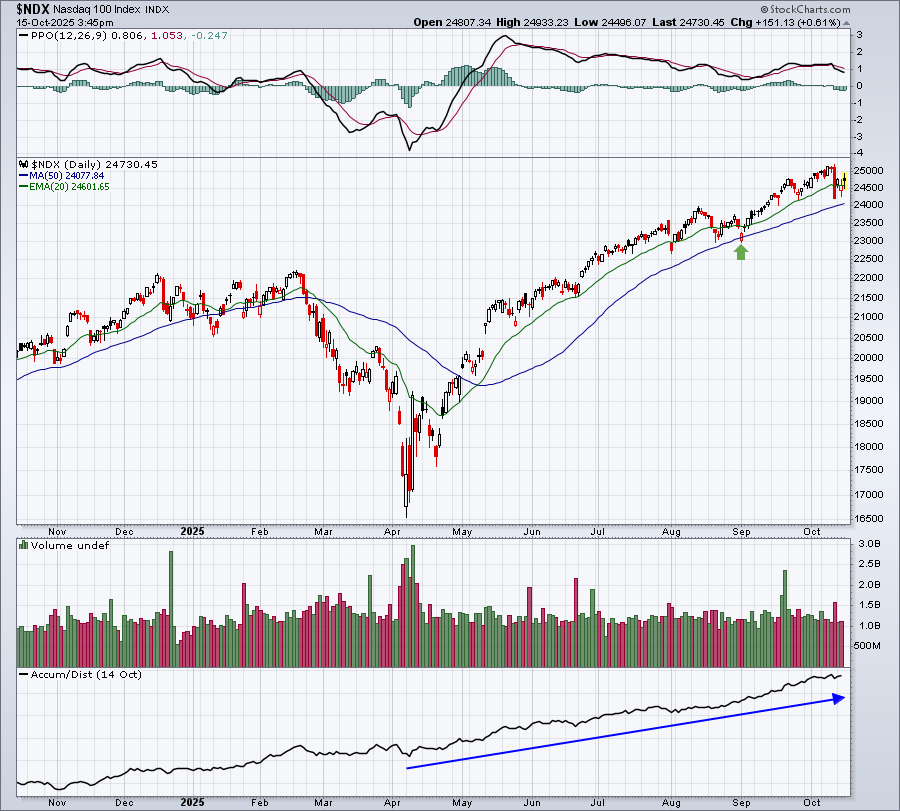
I like to follow AD lines (Accumulation/Distribution lines) as they provide a sense of confirmation for me. AD lines strengthen from afternoon buying and most market pundits will tell you that retailers react and buy/sell in the morning, while institutional buying generally takes place later in the day. A strong AD line tells us that action is mostly being dominated by afternoon buying.
Therefore, I want to see a rising AD line on our major indices. Check these out:
S&P 500
NASDAQ
Russell 2000 (IWM)
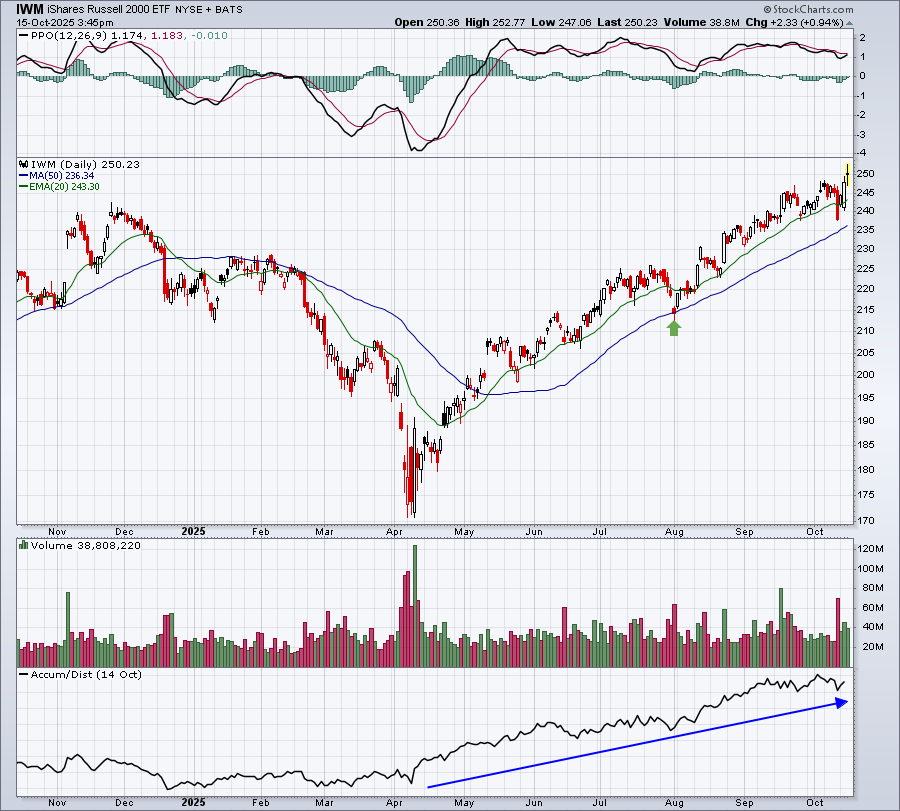
Based on the current AD lines, it certainly appears that Wall Street continues to support higher prices on our major indices.
Sectors/Industries
Asset managers ($DJUSAG) had been a leading industry group within the financial sector and vs. the S&P 500 until late July. The group consolidated for a couple months, before breaking down last Friday when nearly every area of the market sold off. It has since begun to recover, challenging its 20-day EMA in the process. As I look at the group's 60-minute chart, I see a potential bottoming reverse head & shoulders pattern. A breakout above the neckline would be particularly bullish since such a breakout would also represent a move back up and above the 20-day EMA on a daily chart. Here's the pattern I'm looking at:
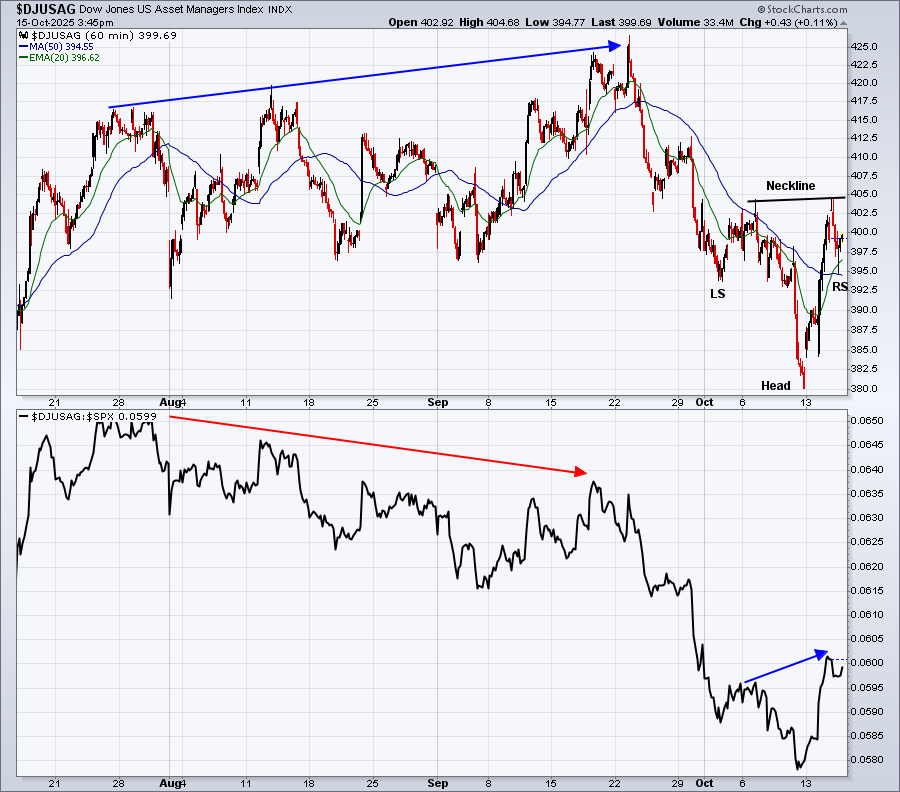
Note that the DJUSAG was losing relative strength over the summer as it was hitting new absolute price highs. The opposite now appears to be true. Check out the relative strength as the right side of the neckline formed. Relative strength is WAY higher than it was when the left side of the neckline printed. It appears that money is rotating back towards asset managers now and that is only likely to accelerate if the 405 neckline resistance is cleared. The measurement on this reverse head & shoulders pattern is to 430, which would represent an all-time high.
ChartLists and Trading Strategies
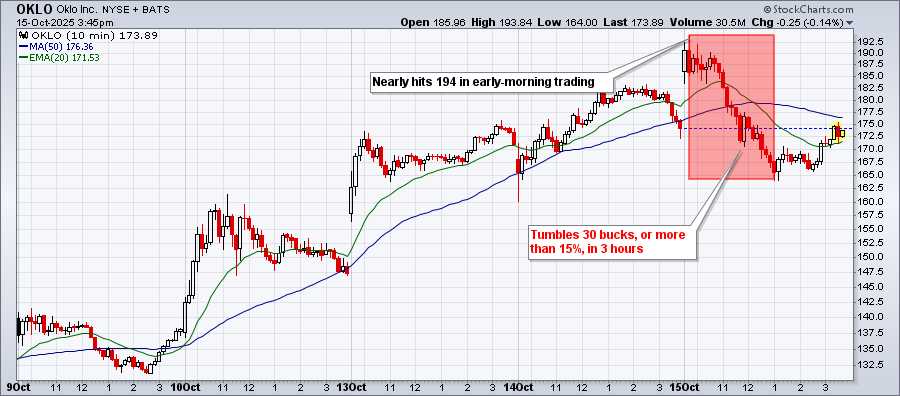
Yesterday, I featured two stocks, OKLO and RGTI, that could have significant near-term issues as both stocks have a TON of net in-the-money call premium. Both of these stocks were discussed at length yesterday afternoon in our monthly Max Pain session.
Both gapped higher this morning, but then quickly erased those gains, highlighting the incredible risk of owning these stocks when market makers have incentive to move both lower. Check out the intraday charts of OKLO and RGTI to see the type of quick reversals that I was talking about:
OKLO
RGTI
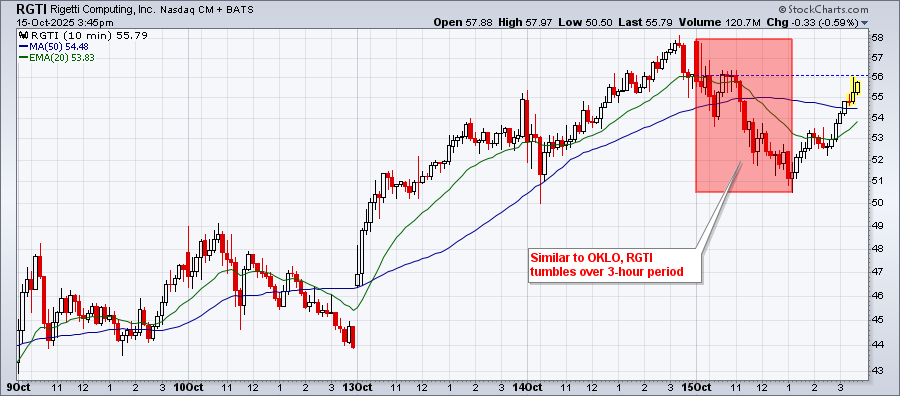
They're currently rebounding this afternoon, but I just wanted to point out the risk of jumping in on a stock during options expiration week that has so many in-the-money calls.
Upcoming Earnings
We have begun tracking the daily Upcoming Earnings and the Weekly Upcoming Earnings Relative Strength ChartLists for Q3 earnings. They are included on our website under ChartLists.
Economic Reports
Economic reports due out based on government data continue to be delayed, because of the U.S. government shutdown.
Happy trading!
Tom