
EB Daily Market Report - Wednesday, October 22, 2025
Executive Summary
- Futures were mixed to slightly lower overnight and our major indices did open mixed as well
- Cryptocurrencies were selling again today, led by Solana ($SOLUSD, -6.40%)
- Meta Platforms (META, -0.12%) loss was muted, despite an announcement that the company was laying off 600 employees in its AI unit
- Gold (GLD, -0.22%) is recovering today after earlier selling saw the yellow metal test its 20-day EMA for the first time in nearly two months
- Crude oil ($WTIC, +2.81%) is jumping back near $59 per barrel
- Energy (XLE, +0.81%) is leading more value-oriented areas higher
- Industrials (XLI, -1.20%) and technology (XLK, -1.18%) are the two weakest sectors
- Specialty retailers ($DJUSRS, -6.50%) is the worst-performing industry group, led by Carvana's (CVNA, -8.66%) drop to test key support just above 320
- Netflix (NFLX, -10.04%) disappointed Wall Street with earnings that fell short of estimates; next up on earnings deck is Tesla (TSLA, -1.05%)
Market Outlook
I'm of the opinion that we could be starting the "C" phase of an A-B-C correction. Usually, this type of pattern is nothing more than a period of selling/consolidation after a secular bull market advance and before the next leg of the bull market begins. I believe the "A" occurred a week ago Friday when we saw that HUGE red candle print across our major indices and sectors. The rally since that Friday marks the "B" phase, and now I believe the selling today could be starting that "C" phase. Here is how it might play out:
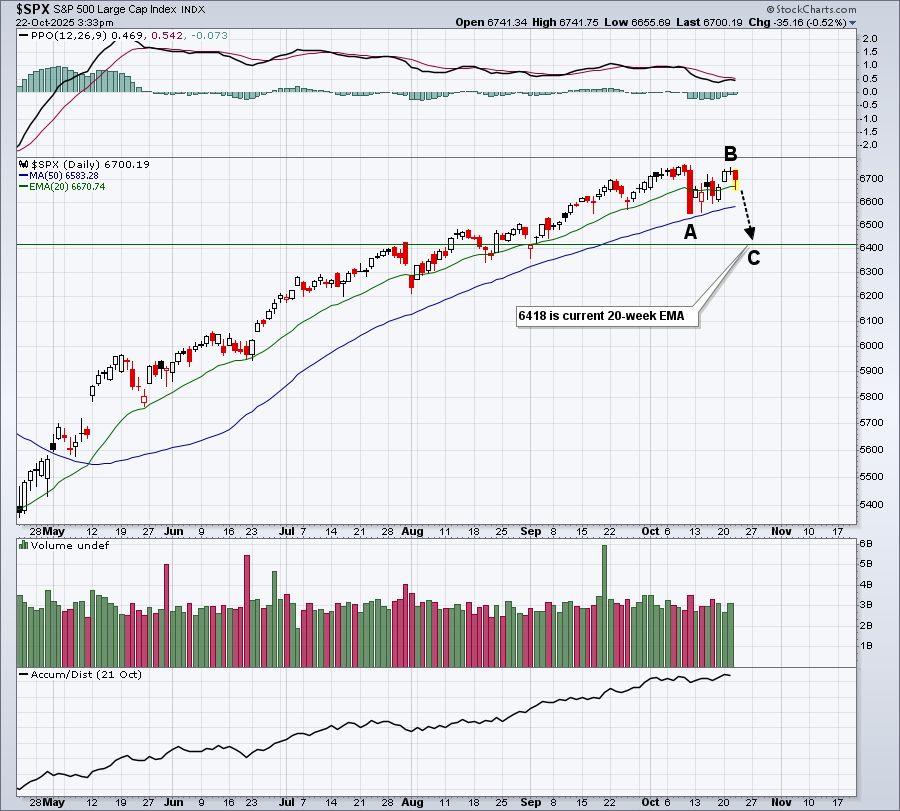
The horizontal line at 6418 represents the 20-week EMA, which is not featured on this daily chart. When we see a bit of increased selling on the daily chart, I'll generally turn to the longer-term weekly chart. Rising 20-week EMAs typically provide support on a longer-term basis, similar to how the 20-day EMA provides support in the very near-term.
U.S. stocks have been quite resilient and we could simply see another all-time high later this week, but I believe most signs point to either further consolidation or a bit of selling.
Sectors/Industries
If you've followed our practices for many years, then you know how I feel about an elevated Volatility Index ($VIX). I always say, "nothing good happens when the VIX crosses above 20 and is rising." Recently, the VIX surged well into the 20s to accompany Phase "A" downside a week ago Friday. We did move back down into the 17-20 range on the VIX, which is helpful, but it's not low enough for me to rule out another surge in the VIX and another drop in equity prices. The VIX did move back up to 21 earlier today, though it's since pulled back to the 18s as the bulls attempt an afternoon rally.
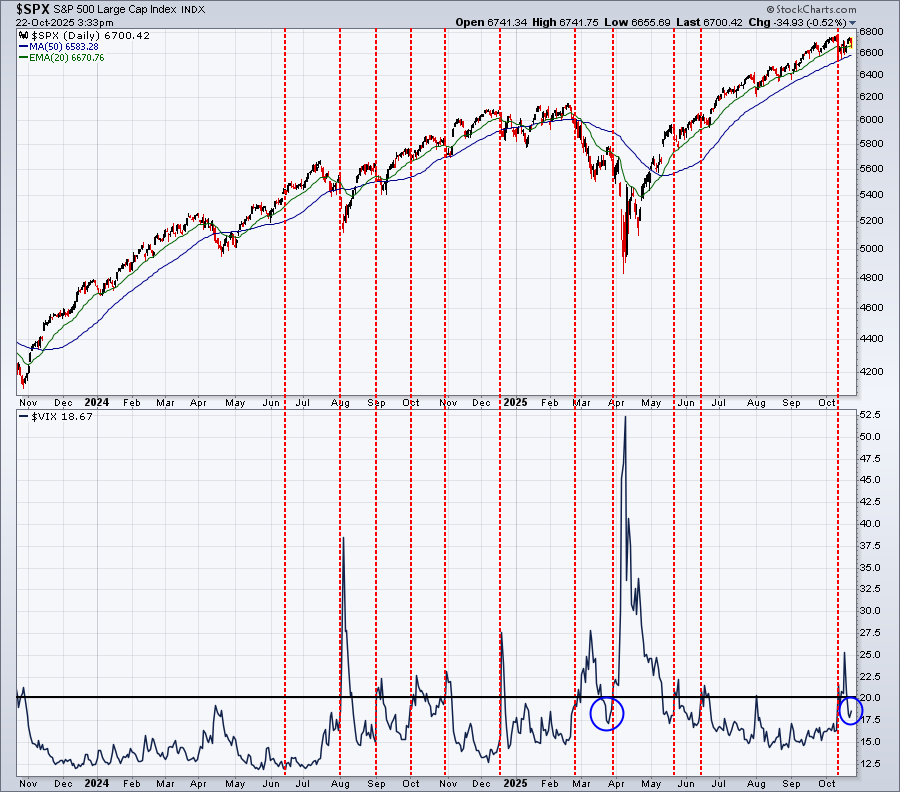
The red-dotted vertical lines mark various times when the VIX moves above 20. On most occasions, the VIX surge above 20 marks a market bottom and then the secular bull market resumes. However, you can see that the surges above 20 in both February and again in late March foreshadowed much deeper selling. The blue circle highlighted the temporary move back into the 17-20 range back in March, just before further selling kicked in. I circled the current move back into the 17-20 range to highlight that that's where we're at currently. Has the VIX surge ended? Or are we about to get a double dose above 20? If it's the latter, then we'll very likely see Phase "C" emerge in this potential A-B-C corrective pattern.
ChartLists and Trading Strategies
Today marks the start of the weakest 6-day historical stretch on the S&P 500, dating back to 1950. This period has moved lower 44 of the past 75 years, while gaining ground the other 31 years. This is by no means a slam dunk of selling ahead. It's simply providing us a market tendency.
Personally, I try to limit my trading this week, hoping to capitalize next week on pullbacks. Next Monday's close (October 27th) starts the most bullish time of the year, so at least history is much better aligned next week for long trades.
Upcoming Earnings
We have begun tracking the daily Upcoming Earnings and the Weekly Upcoming Earnings Relative Strength ChartLists for Q3 earnings. They are included on our website under ChartLists.
Economic Reports
Economic reports due out based on government data continue to be delayed, because of the U.S. government shutdown.
Happy trading!
Tom