
EB Daily Market Report - Thursday, October 30, 2025
Executive Summary
- Futures were mixed overnight, but turned decidedly negative heading into the opening bell
- The growth-oriented NASDAQ 100 ($NDX, -1.03%) is the lagging index today as both Meta Platforms (META, -11.40%) and Microsoft (MSFT, -3.21%) trade lower following their quarterly results
- Alphabet (GOOGL, +3.16%) is trading higher following its better-than-expected results
- 6 sectors are higher today, led by real estate (XLRE, +0.79%) and financials (XLF, +0.67%)
- Consumer discretionary (XLY, -1.51%) lags mostly due to weakness on the part of automobiles ($DJUSAU, -3.53%), particularly Tesla (TSLA, -3.98%)
- Cryptocurrencies are down across the board as the "risk off" trade dominates market action
- Commodities are mixed as gold (GLD, +1.72%) sees a bounce-back day; thus far, GLD has been unable to reclaim its 20-day EMA, however
- The 10-year treasury yield ($TNX) is up 4 basis points to 4.10%, trying to clear its 50-day SMA for the first time since late July
- Apple (AAPL, +0.62%) and Amazon.com (AMZN, -2.28%) are set to report their latest quarterly results after the bell today
Market Outlook
We've seen both the S&P 500 and NASDAQ 100 pierce resistance and climb to all-time highs in recent sessions, despite some of the selling that we've seen over the past 24 hours or so. Any time we're marching to new highs, especially after recent consolidation, I like to look at our key growth vs. value sustainability ratios for confirmation. Here's what the S&P 500 looks like right now, with key sustainability ratios in the panels below the S&P 500 price chart:
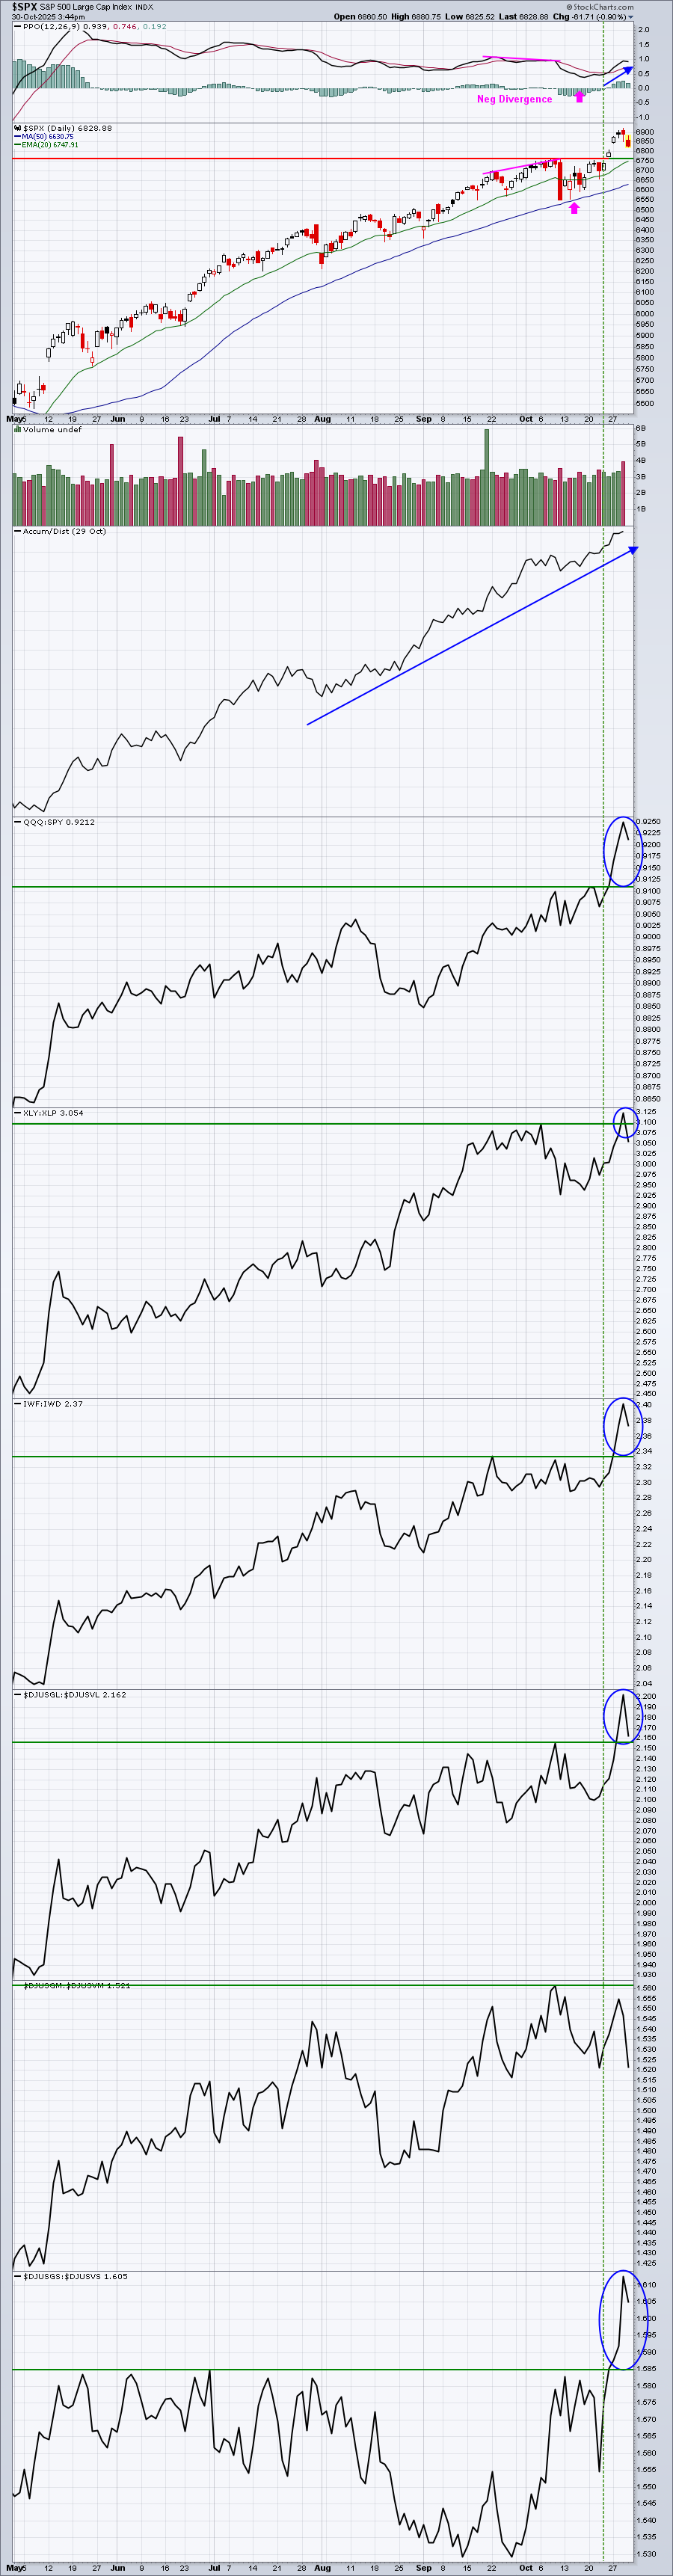
Here are a few comments on the above chart:
- There was a negative divergence, highlighted by the pink lines showing a higher price with a lower PPO during the first half of October. When this occurs, I look for a PPO centerline test, 50-day SMA test, or both (pink arrows). In this case, we nearly saw a 50-day SMA test, so as far as I'm concerned, there was a technical "reset" of the PPO and now we're seeing the PPO accelerate to the upside, indicative of bullish market momentum.
- As price has broken out over the past week on multiple occasions, the AD line has also moved higher to set new highs. This suggests further Wall Street accumulation and is consistent with further advances in secular bull markets.
- Also as price has broken out, nearly every one of our sustainability ratios has broken to a new high as well to support this advance and suggesting that the current rally is sustainable. Even the XLY:XLP ratio set a new recent high as money has rotated significantly into discretionary vs. staples, a bullish development
- Only mid cap growth vs. value failed to set a new relative high and it came close.
Based upon this chart alone, I believe it's very unlikely that we're going to see any kind of major selloff. Shallow pullbacks are certainly possible at any time and very difficult to predict with any precision, but my 7000 target on the S&P 500 seems to be right around the corner.
Sectors/Industries
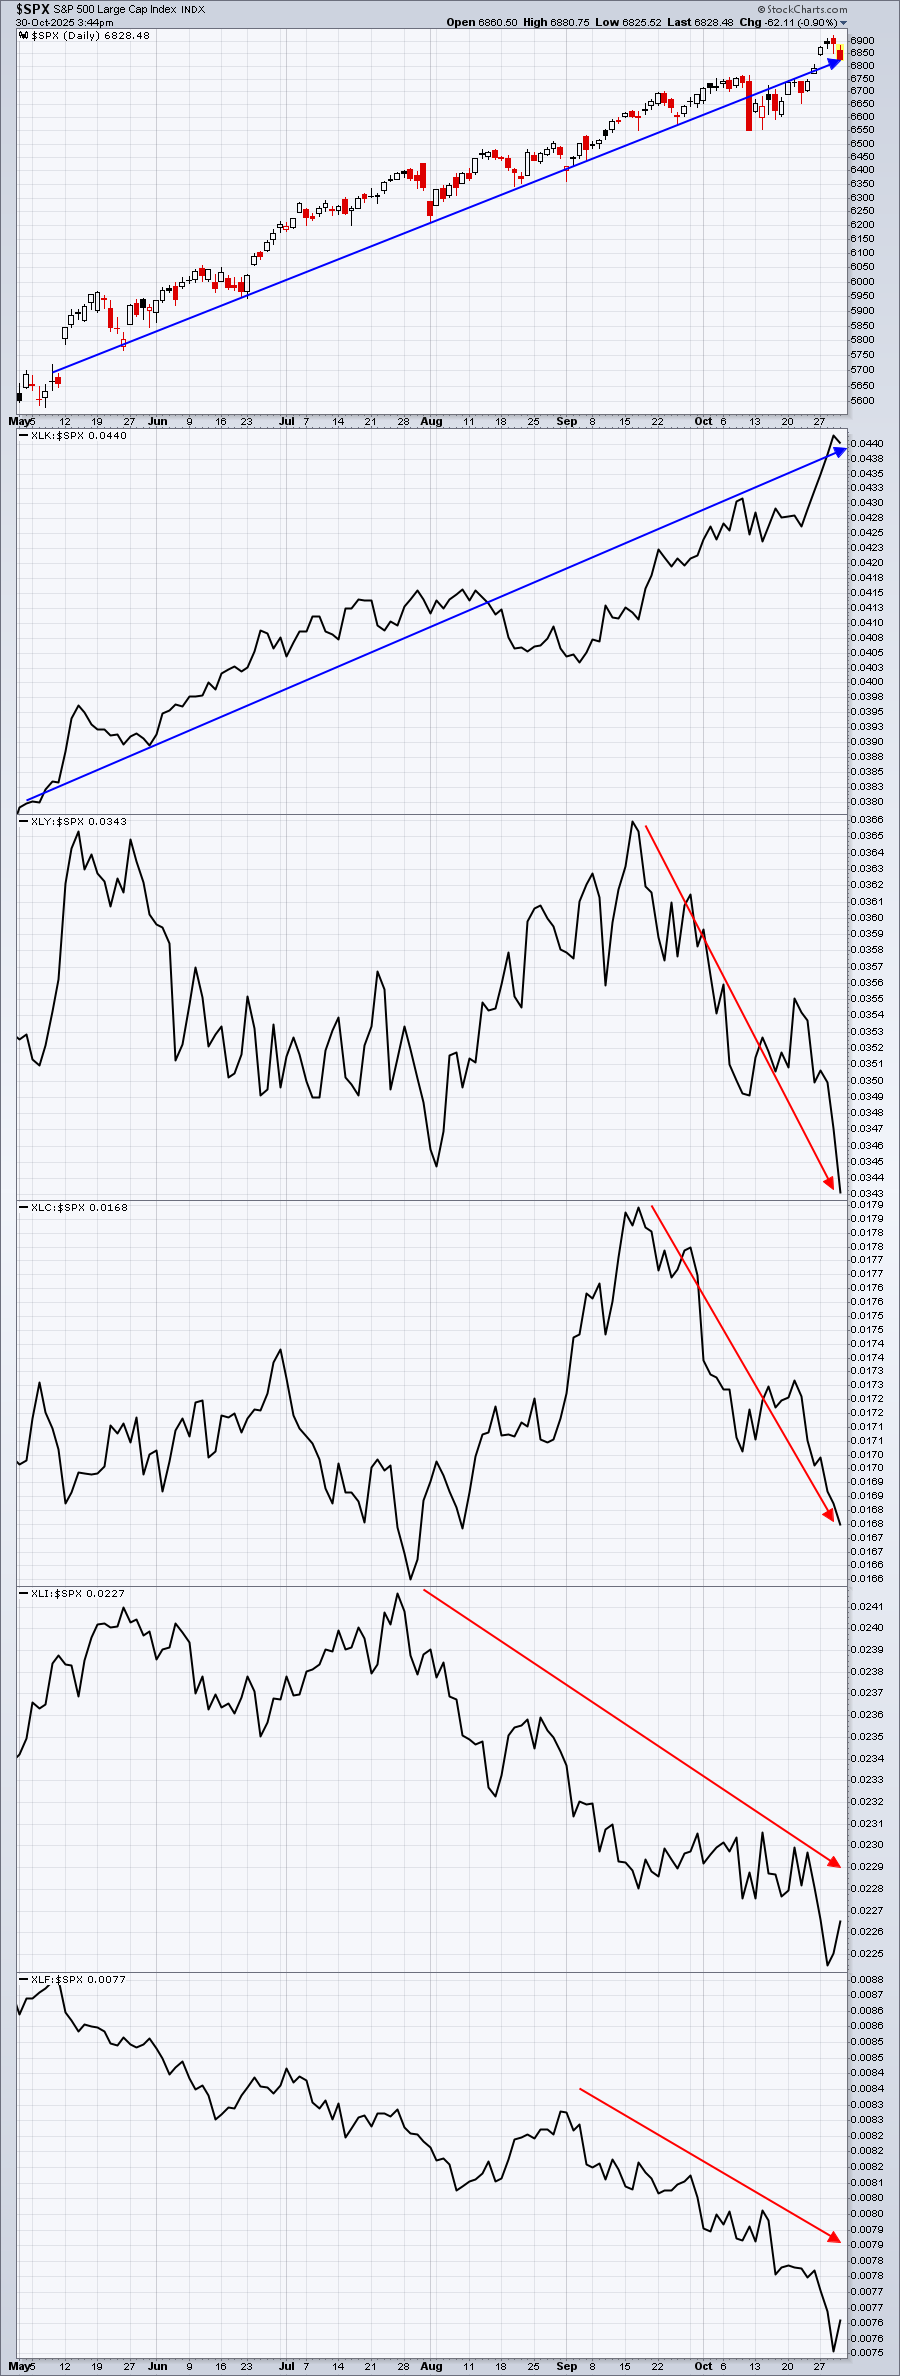
In addition to the sustainability ratios shown above, I also like to review the relative strength of the aggressive sectors (XLK, XLY, XLC, XLI, XLF) and defensive sectors (XLV, XLP, XLRE, XLU) vs. the benchmark S&P 500. If the S&P 500 is moving to new highs and we see a lot of relative strength in those latter defensive areas, that can be problematic. So let's check them out:
Aggressive Sectors
Defensive Sectors
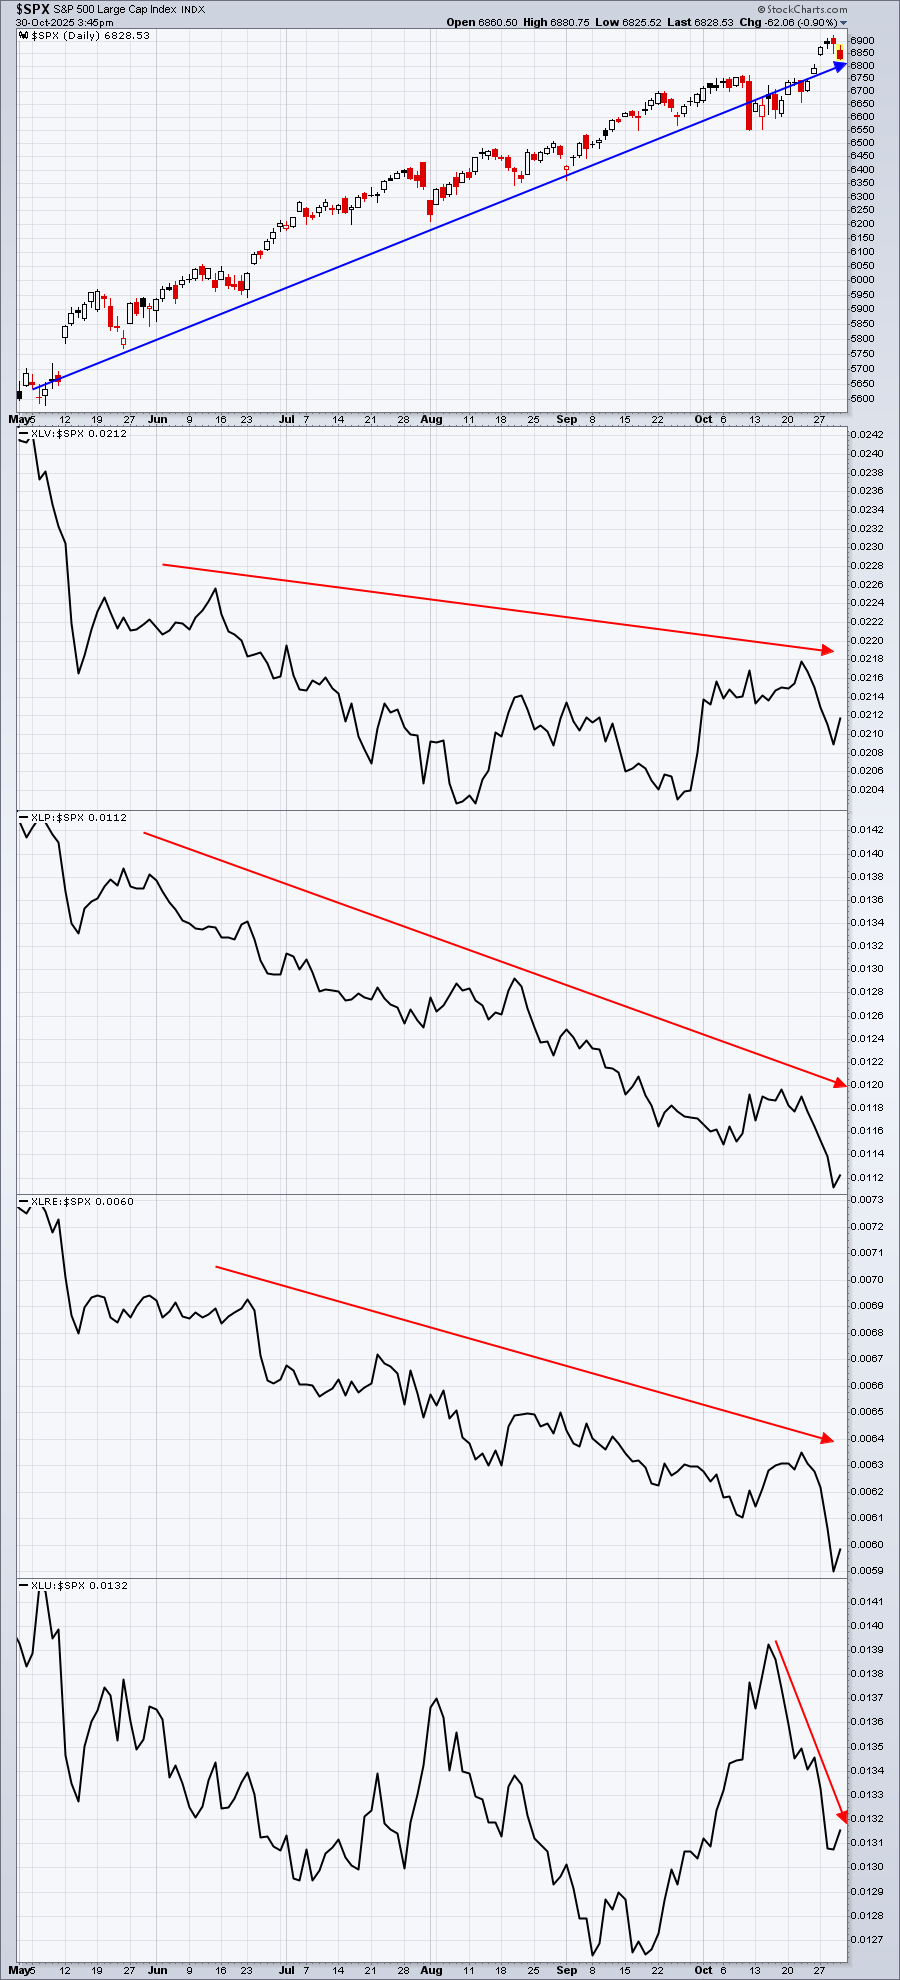
At first glance of the aggressive sectors, I was concerned by how weak the relative strength was of the XLY, XLC, XLI, and XLF. But when you look at the defensive sectors, they're also quite weak on a relative basis. I think it's important to understand that the XLK is SOOO strong that there's not room for any other sector to really outperform. And that's not a bad thing. Technology is our MOST aggressive sector and it has a long history of leading bull market advances. If inflation were expected to surge or a recession was looming around the corner, Wall Street would be exiting this aggressive sector. Instead, Wall Street is jumping in with both feet.
Overall, I find this to be very constructive for U.S. stocks.
ChartLists and Trading Strategies
Given that relative strength resides in technology, that's the area where I'd consider doing most of my short-term trading, at least until other sectors begin to show more relative strength.
Upcoming Earnings
We have begun tracking the daily Upcoming Earnings and the Weekly Upcoming Earnings Relative Strength ChartLists for Q3 earnings. They are included on our website under ChartLists.
Economic Reports
Economic reports due out based on government data continue to be delayed, because of the U.S. government shutdown.
Happy trading!
Tom