
EB Daily Market Report - Special Report - Tuesday, December 2, 2025
The stock market has started throwing us curve balls. If you've been a long-time member of EarningsBeats.com, then you know I primarily remain bullish. I don't grow cautious or bearish very often, but when I do, I have good reason(s).
Now is the time to grow more cautious.
Let me be clear. Growing cautious and calling for a bear market are two different things. I am not calling for a bear market. When I talked "cautious" back in late January and February, I never said I was expecting a bear market. I did think a correction was possible and I do believe another one is now possible. There are too many warning signs flashing to ignore the risks of remaining long. It does not mean the stock market cannot go higher. Bull markets can be incredibly resilient and climb higher in the face of overwhelmingly bearish market conditions.
A few recent developments have turned me much more cautious. The most significant has been the nature of the recent rally. My sustainability ratios have barely budged back to the upside as the S&P 500 has made its way back to within 1% of its all-time high. Sustainability ratios are not following suit:
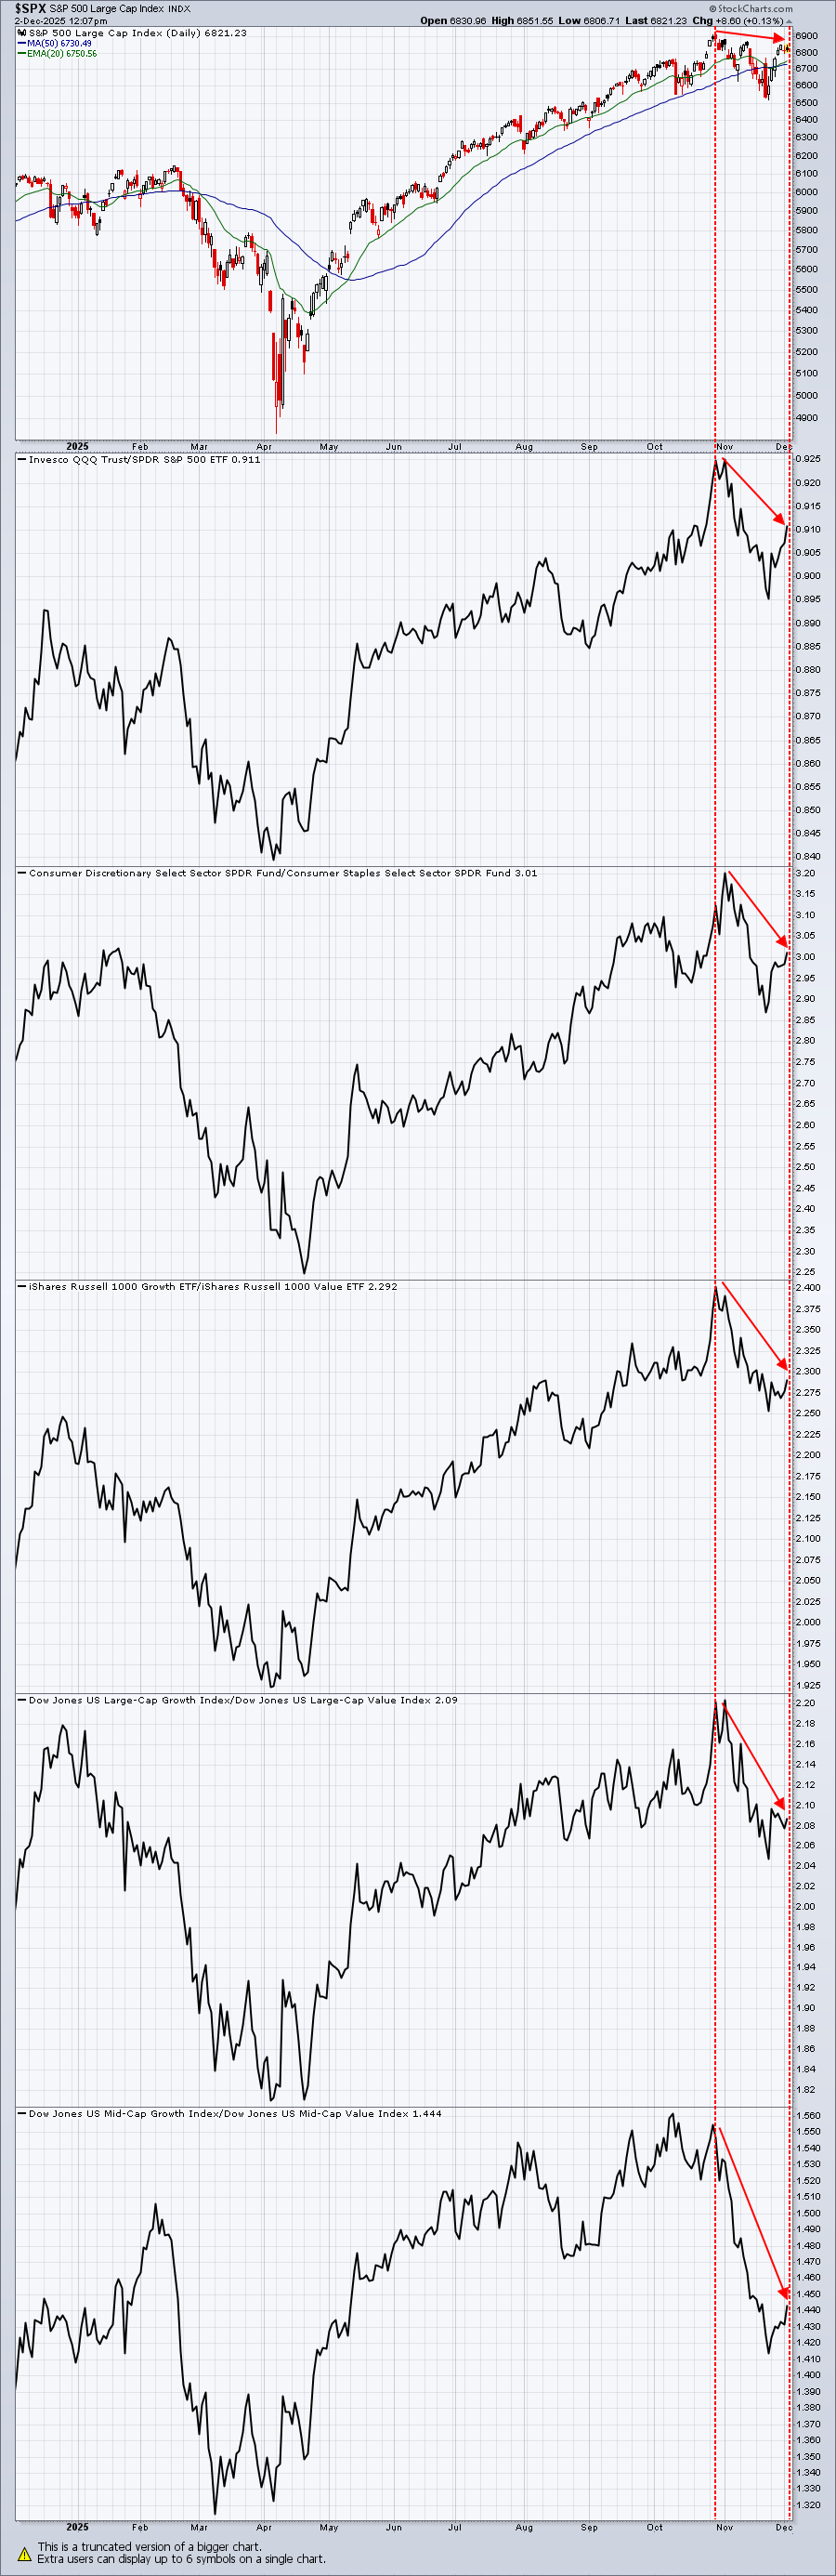
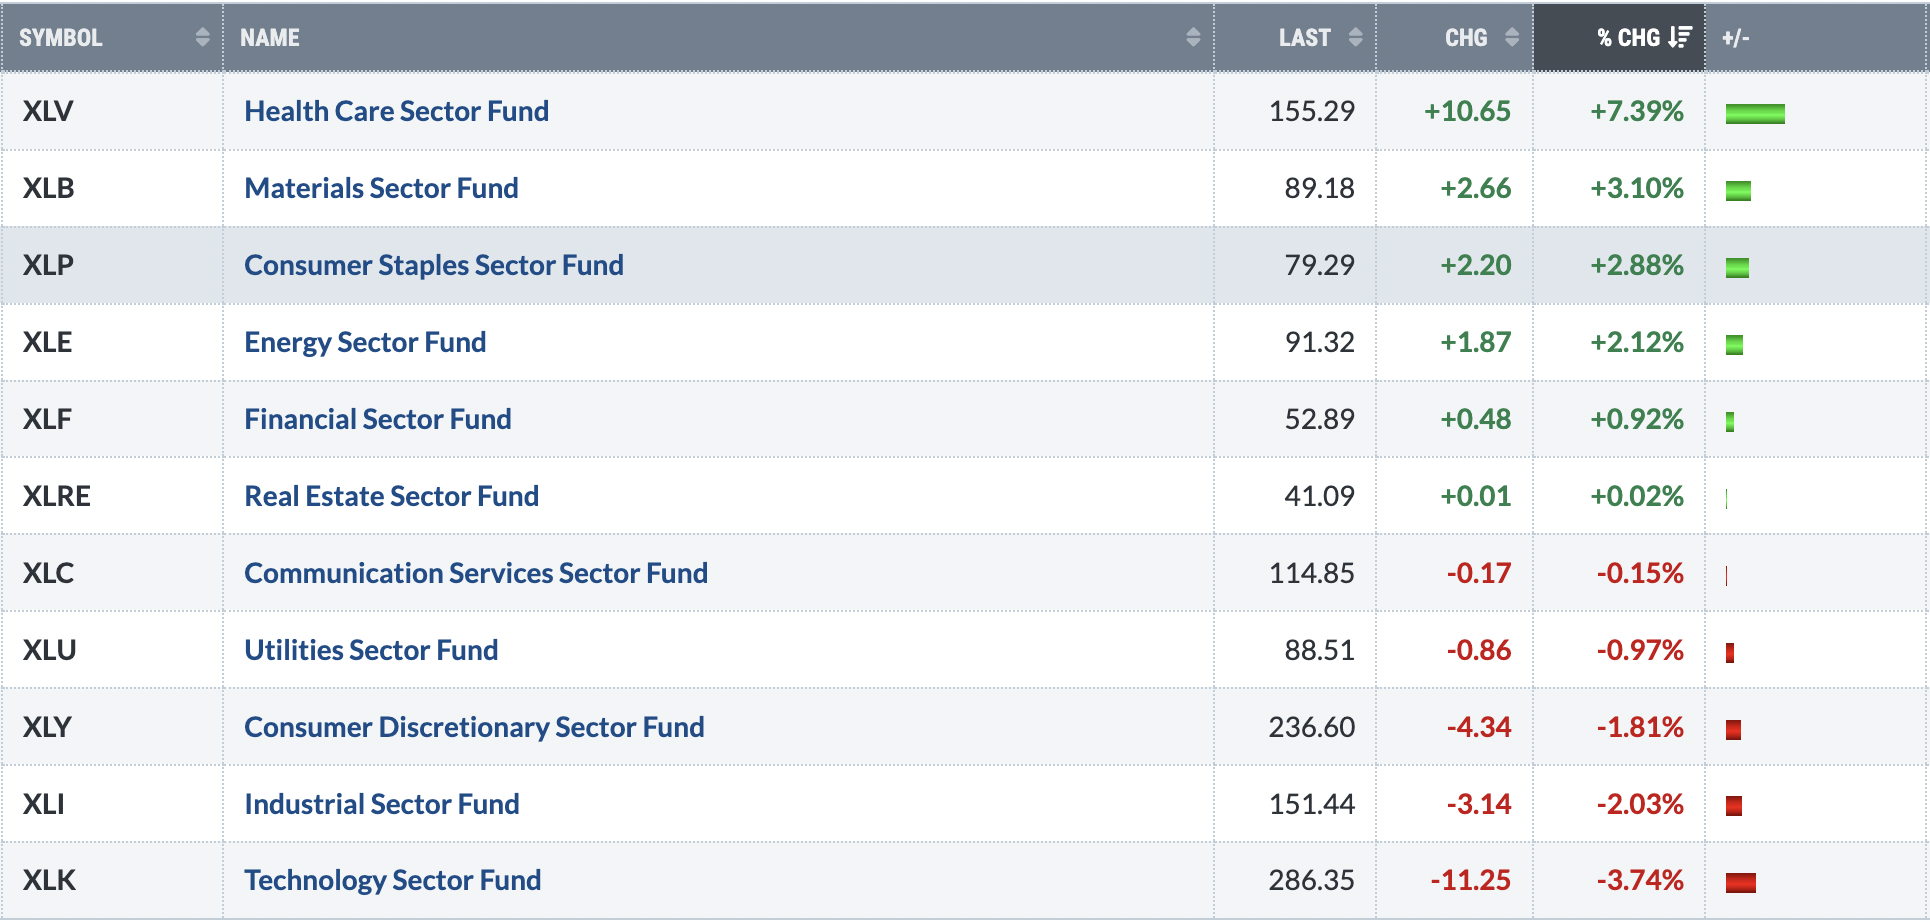
Sector rotation is also badly lacking. On November 3rd, the S&P 500 was at 6852. At last check, it was at 6830. While the S&P 500 has been relatively flat over the past month, check out this one-month sector performance:
I discussed a few other warning signs on this morning's Trading Places Live show. You can check out that video here:
I want to discuss one other key factor that I did not mention in yesterday's Weekly Market Report nor did I mention it on our Trading Places Live show this morning. Specifically, I want to walk you through how the S&P 500 has been trading on an intraday basis.
As many of you know, I keep a Key Manipulation spreadsheet where I track the SPY, QQQ, IWM, and a couple dozen individual stocks (Mag 7 plus many others). I specifically review how all of these securities trade throughout the trading day, breaking it down by the various time frames:
(1) gap opens
(2) 9:30-10:00
(3) 10:00-11:00
(4) 11:00-2:00
(5) 2:00-4:00
Many folks refer to early action in the market, including the opening gaps and the first 30-90 minutes of trading as "amateur hour". I believe plenty of manipulation takes place early in trading days. Bottoms almost always form with huge selling on opening gaps and in the morning, which is then followed by buying in the afternoon by "smart money", or the big Wall Street firms.
Recently, there's been some very odd trading during the day. In fact, here is how the S&P 500 (SPY) traded from the close on November 12th (683.38) to the close last Friday, November 28th (683.39). The SPY gained one penny during this period, but check out the cumulative gains (losses) by time period of the day:
(1) gap opens: +5.49
(2) 9:30-10:00: +9.23
(3) 10:00-11:00: -1.96
(4) 11:00-2:00: -1.25
(5) 2:00-4:00: -11.45
While there was no change in the SPY over these couple weeks, there was clearly "amateur hour" buying followed by "smart money" selling. While yesterday was not included in the calculations above, it was more of the same, at least in terms of afternoon selling.
If I stretch this analysis back to the close on October 27th, the SPY was trading at 685.18. So there's been a drop of two bucks in the SPY since that time and gaps and early morning action have seen a gain of more than 17 bucks, while the balance of the day saw a loss of 19 bucks.
This doesn't prove anything, but it just seems as though there's been more distribution than might appear, simply by looking at the price charts. By itself, I might think nothing of it. But on top of the other warning signs I'm seeing, I believe it's noteworthy.
I don't have a crystal ball. If we are topping, it's very difficult to guess the exact timing. What I do know now, however, is that the RISK of investing has increased significantly and THAT is the part that bothers me.
Happy trading!
Tom