
EB Daily Market Report - Tuesday, January 6, 2026
Executive Summary
- Futures were mixed overnight and that's the way we opened
- The Dow Jones ($INDU, +1.02%) has provided leadership throughout the session and looks to close over 49000 for the first time in history
- Value stocks (IWD, +0.83%) are outperforming growth stocks (IWF, +0.50%), though both groups are gaining ground
- Health care (XLV, +2.01%) and materials (XLB, +1.80%) are leading the market higher
- 9 of 11 sectors are higher, though energy (XLE, -2.58%) is weak given the 1.7% drop in crude oil to $57 per barrel
- Semiconductors ($DJUSSC, +1.30%) are strong, though NVIDIA Corp (NVDA) is flat
- Medical equipment ($DJUSAM, +2.57%) is leading a very strong health care sector
- Silver ($SILVER, +4.66%) is surging again, nearing its recent all-time high set one week ago
Market Outlook
The good news is clearly the all-time highs being set on both the Dow Jones and S&P 500 today. It's never a bad thing to see all-time highs. Unfortunately, the bad news is that we've seen little improvement in the "beneath the surface" signals that I like to monitor. Two charts, in particular, bother me and make it difficult for me to get behind the current rally.
First, let's look at one of my favorite sustainability ratios - XLY:XLP. This measures the relative performance of consumer discretionary stocks vs. consumer staples stocks. Historically, the direction of this XLY:XLP ratio tends to correspond rather directly with the S&P 500. The correlation coefficient will back me up on this relationship. I like to review these ratios from an "intraday" perspective, ignoring gaps, which can represent nothing more than market maker manipulation. When the stock market is healthy, this intraday XLY:XLP ratio tends to move higher with the S&P 500. That is not the case currently, however, as you can see from the chart that I shared yesterday in the EB Weekly Market Report:
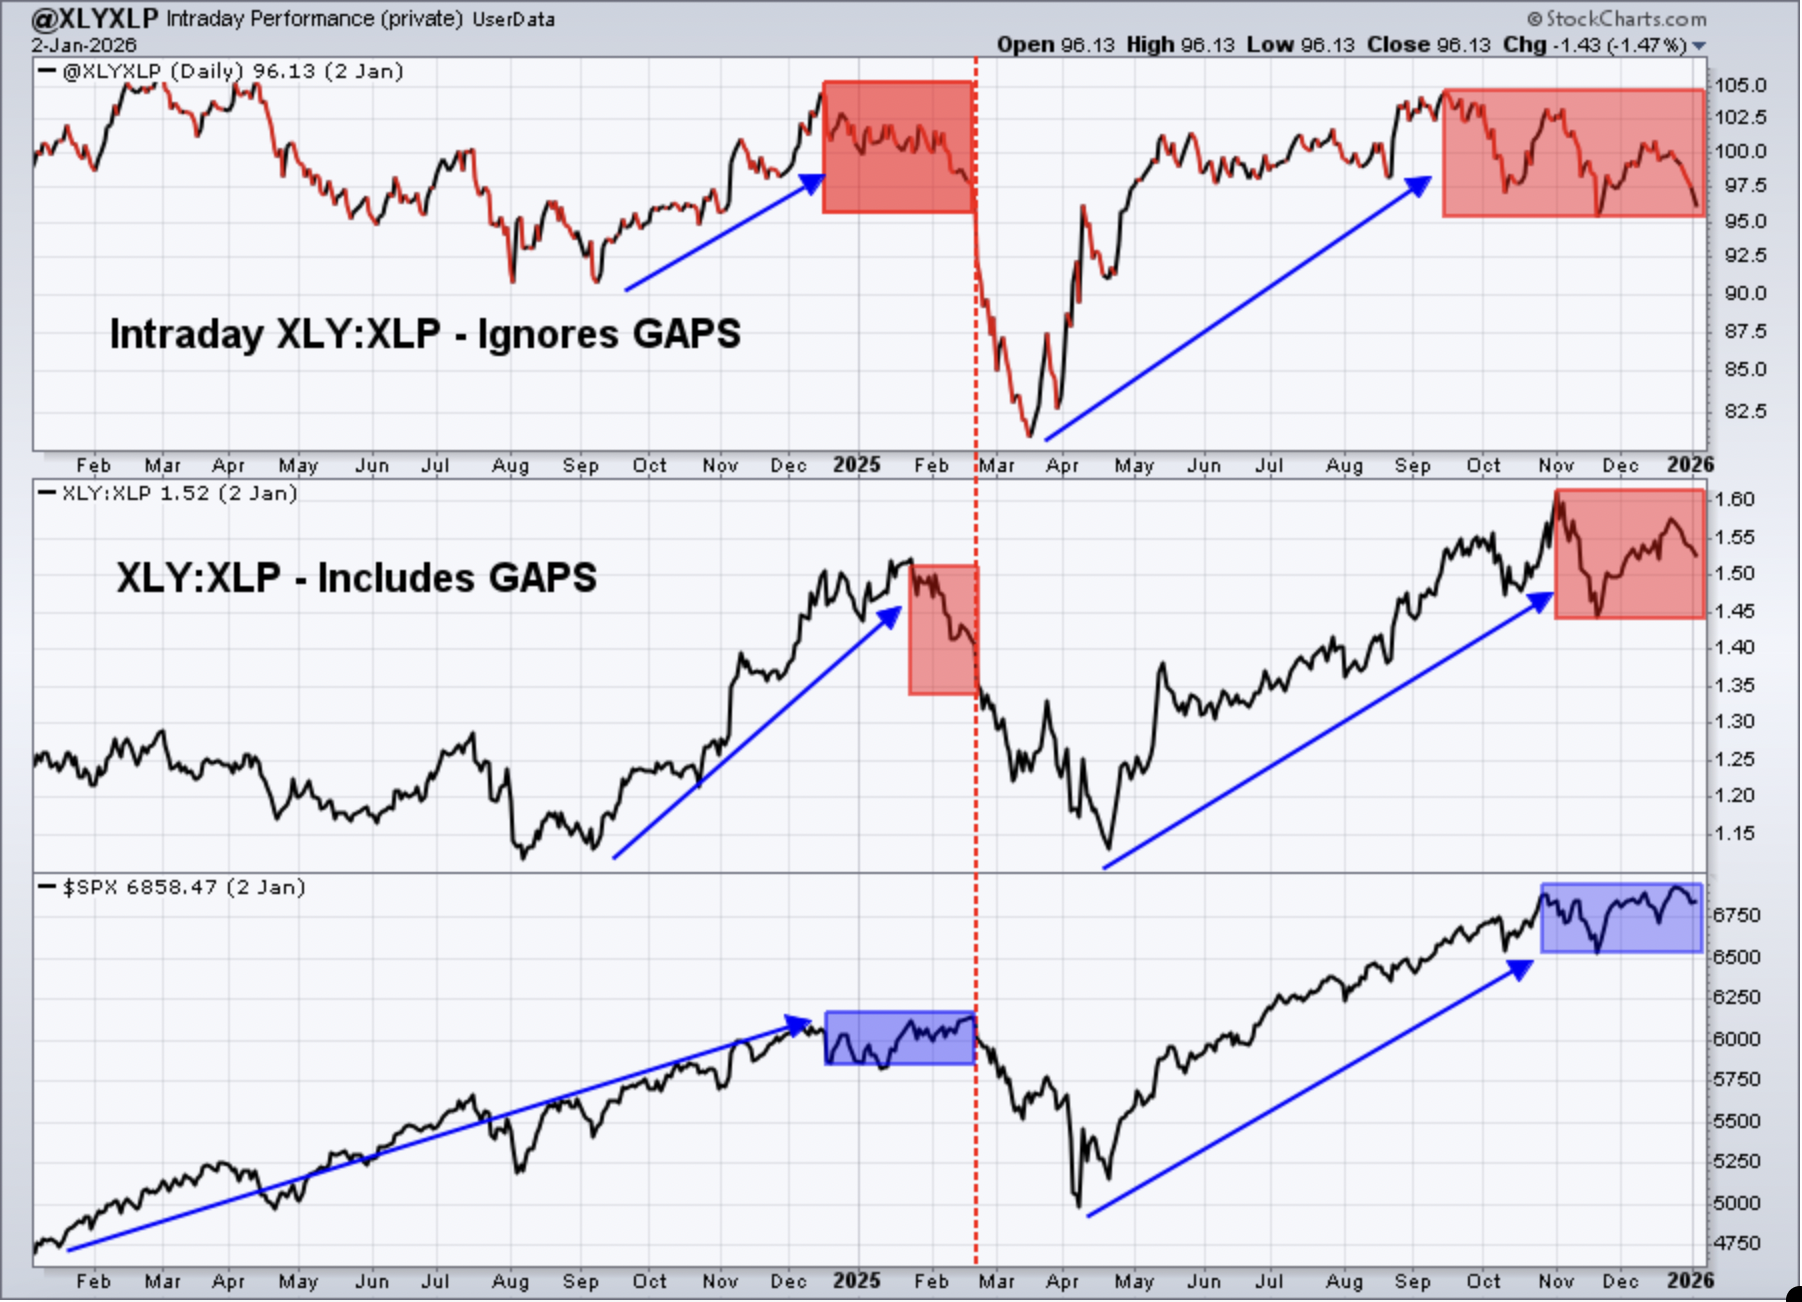
You can see that the intraday rotation from the XLY to the XLP is looking a lot like it did in early 2025, just prior to a significant market top. That's why I like to follow this relationship so closely.
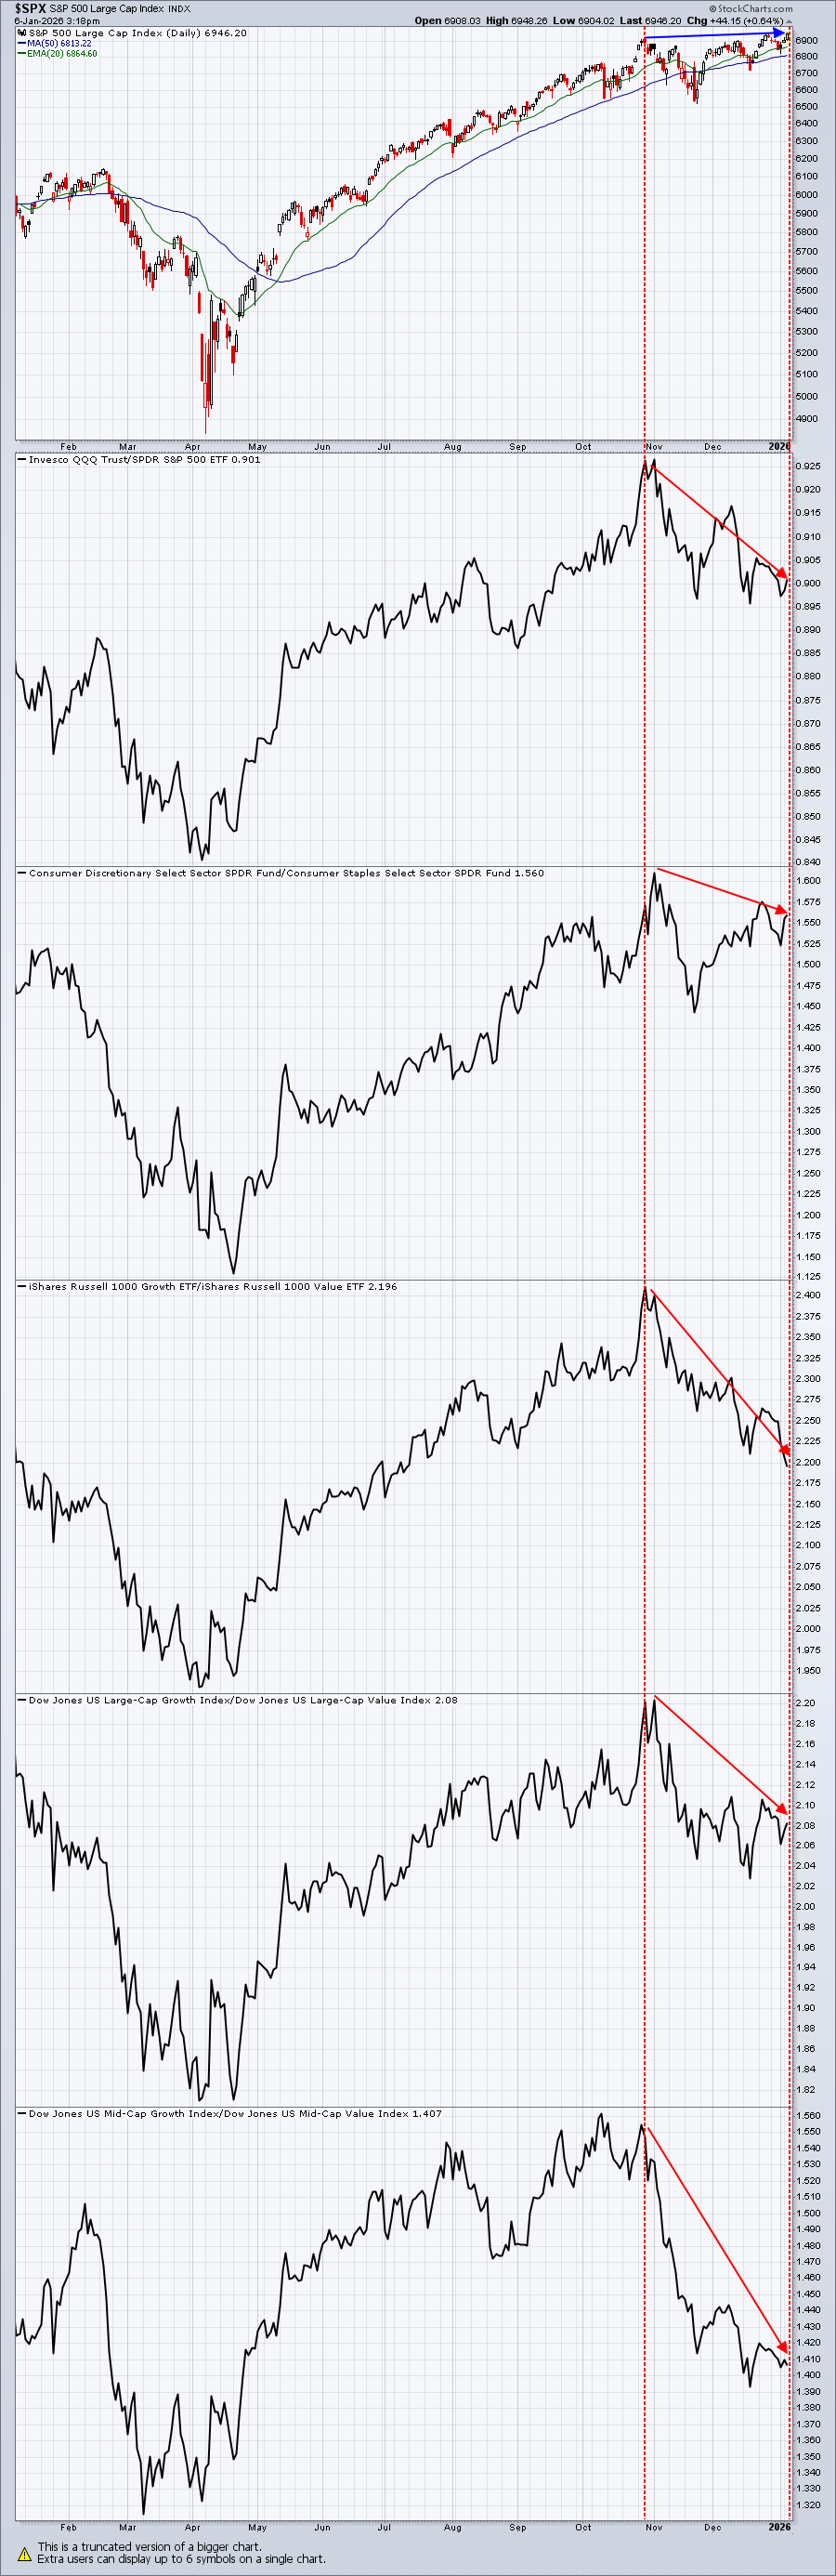
The other key intermarket relationship ratio that is warning us is the IWF:IWD ratio, which pits large-cap growth stocks vs. large-cap value stocks. A rising ratio typically accompanies a rising S&P 500. Currently, though, it's easy to see that there's a problem. The following S&P 500 chart is one that I show often as there are several intermarket relationships worth monitoring, not just the IWF:IWD:
 z
zDespite the warnings, a true breakdown doesn't occur until price action confirms the warning signs. Until a reversal occurs, we should respect the all-time highs and be aware of the potential of a market top.
Sectors/Industries
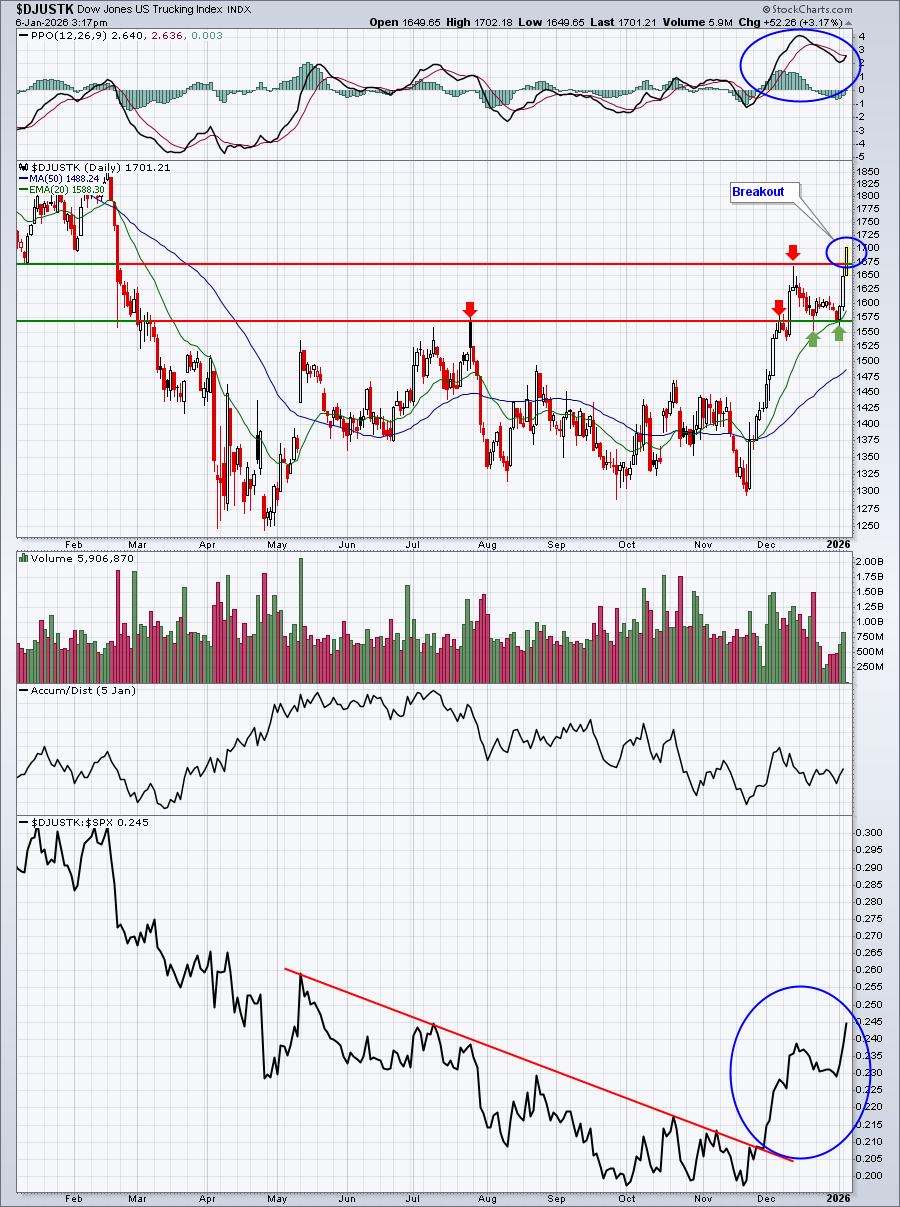
Truckers ($DJUSTK) held onto recent price support and are breaking out again. During MarketVision 2026 on Saturday, I discussed the one very bullish part of the market, which, in my opinion, is the transportation area ($TRAN). Check out the truckers:
ChartLists and Trading Strategies
While I'm clearly nervous about the stock market prospects in 2026, I have no problem with trading along with the trend - for now. I'd just want to make sure I keep my stops in place. Usually, during pullbacks, I fully expect stocks to bounce back, especially leaders. In this current riskier environment, though, a mild pullback could morph into something much deeper. That's why I'd keep stops in play.
One area of the market that typically like January is medical equipment stocks ($DJUSAM). And health care has been very hot of late. Given this, I'd consider trading medical equipment stocks that break out or pull back to key support like the rising 20-day EMA. Here's an example of a medical equipment stock that is performing well (leader) and recently raised guidance:
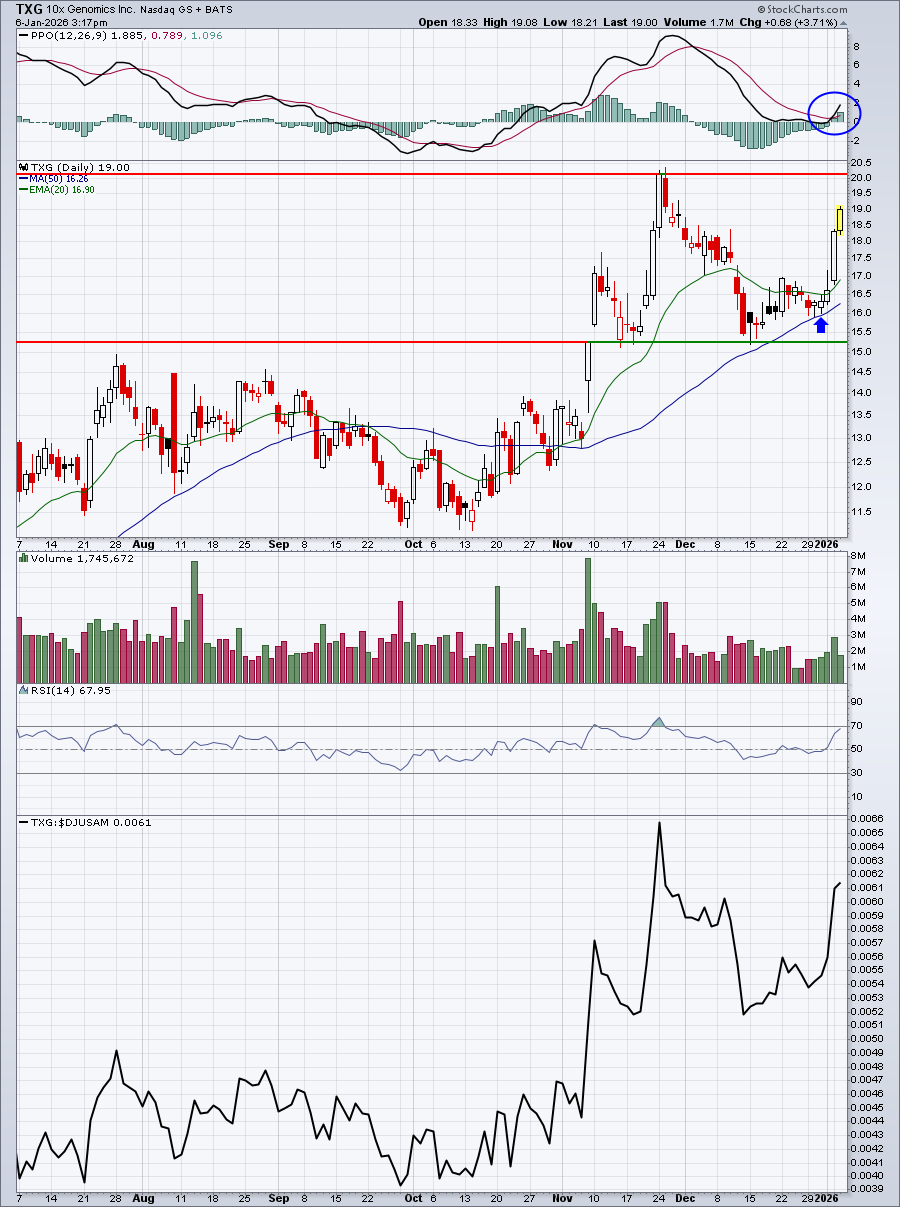
TXG is fairly aggressive. TMO might work better for some. It's also risky, but not nearly as aggressive as TXG. Both stocks recently pulled back to test their respective 50-day SMAs and reset their PPOs to their zero lines. TMO is actually breaking to a fresh 52-week high.
Upcoming Earnings
We are now waiting until Q4 earnings season kicks off in another 10 days or so before publishing our Upcoming Earnings ChartLists and Upcoming Earnings Relative Strength ChartList.
Economic Reports
Initial jobless claims: 224,000 (actual) vs. 225,000 (estimate)
November CPI: +0.0% (actual) vs. +0.3% (estimate)
November Core CPI: +0.0% (actual) vs. +0.3% (estimate)
December Philadelphia Fed manufacturing survey: -10.2 (actual) vs. 3.6 (estimate)
Happy trading!
Tom