
EB Daily Market Report - Tuesday, January 13, 2026
Executive Summary
- Futures were slightly lower overnight, but turned up a bit before the opening bell
- December CPI was released this morning and inflation at the consumer level was slightly below expectations
- Earnings season was kicked off by JP Morgan (JPM, -4.13%) this morning, but it is leading a weak banking group ($DJUSBK, -2.38%) lower
- Financials (XLF, -2.00%) are easily the worst-performing sector on the session
- Meanwhile, energy (XLE, +1.50%) and consumer staples (XLP, +1.00%) lead the action
- Cryptocurrencies are having a solid session as bitcoin ($BTCUSD, +3.08%) trades close to 95,000, a level it hasn't topped since mid-November
- Crude oil ($WTIC, +2.67%) has jumped back above $61 per barrel, also its highest level since mid-November
- The 10-year treasury yield ($TNX) is down just 1 basis point, despite a mostly-benign CPI report
- Moderna (MRNA, +16.24%) is soaring and leading all S&P 500 stocks after announcing it expects to roll out a combined flu and COVID vaccine in 2027/2028
Market Outlook
I've always said that THE most important indicator, BY FAR, is the combination of price and volume. Negative divergences on the PPO are not close. Neither are sustainability ratios and sentiment indicators. So there's no need to grow BEARISH until price action confirms the underlying cautious signals that I've been discussing since early December. Those signals are important, because they make me aware of the potentially dangerous market conditions. If those signals were not present, I'd be long and sleeping like a baby at night. Unfortunately, we have warning signs, so we have to be vigilant about being comfortable with the risks that are present. That can mean (1) moving more of your stock market investments to cash, (2) buying put insurance against your portfolio, (3) buying covered calls against individual positions to lessen downside risk, (4) buying fewer shares, (5) buying index ETFs as opposed to the more volatile individual stocks, (6) allocating a higher percentage of investments/trades to more defensive- and value-oriented areas of the market, or (7) some other risk aversion strategy.
I can only tell you when I see risks increasing. I cannot guarantee a drop ahead. So members should use this information and act accordingly, based on what's most comfortable for you. You may not even agree with my assessment of a higher risk environment, and that's completely fine too. I'm certainly not correct 100% of the time. We do have a strong track record of recognizing risk, however, so I wouldn't take these warning signs lightly.
Sectors/Industries
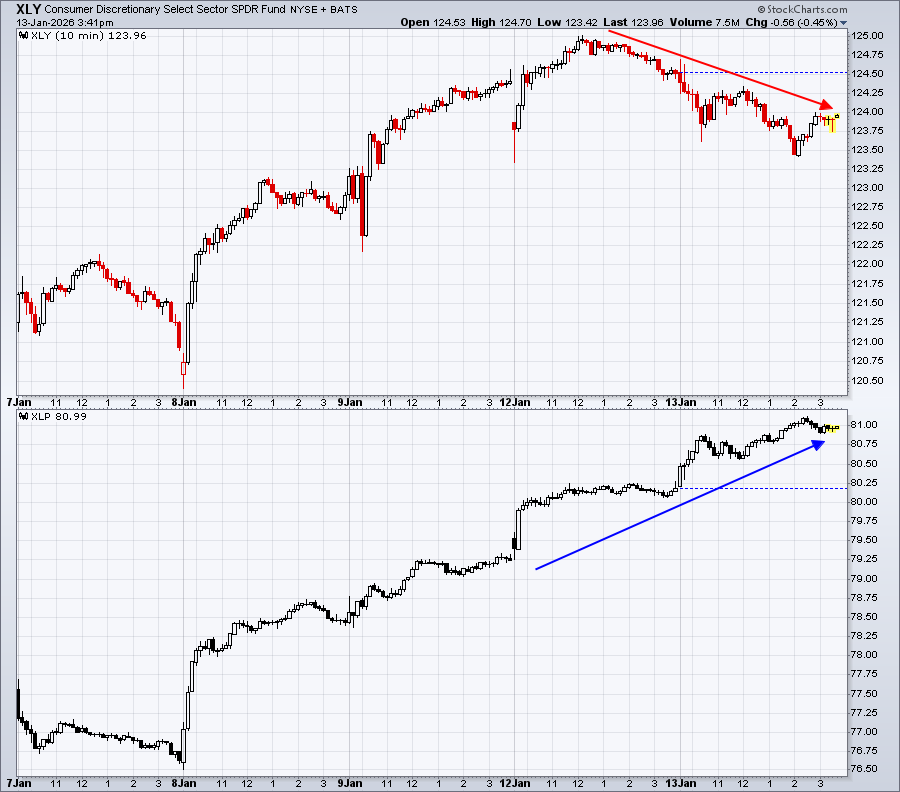
I continue to worry about the money rotating away from growth stocks and more aggressive areas of the market. We saw early strength again today, before a bit of selling kicked in. But the make up of the rally attempt is worrisome. Check out this 5-day 10-minute chart of the XLY and the XLP. Rotation here had been better than some other areas, but that positive rotation flipped over the past day or two. The more cautious rotation is very obvious to me:
ChartLists and Trading Strategies
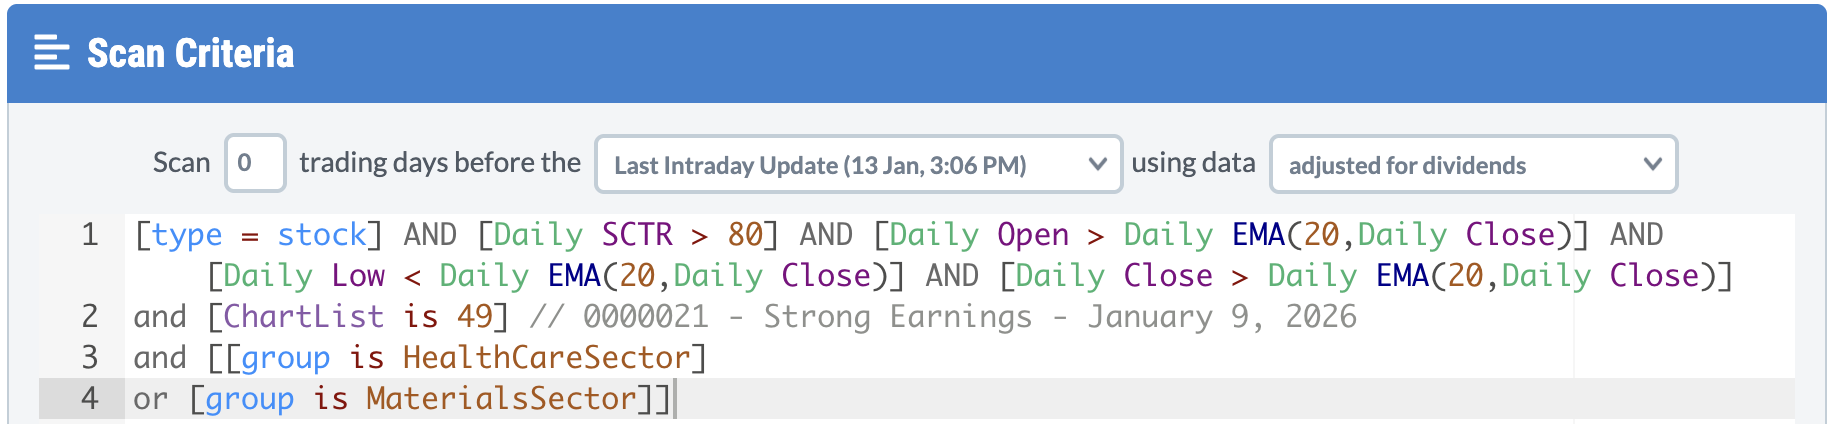
Today's action is again favoring the less risky areas. Large cap value (IWD) is outperforming large cap growth (IWF). Consumer staples (XLP) is outperforming consumer discretionary (XLY). An appropriate trading strategy is to simply trade what's working best in the current market environment. Below I've scanned for strong relative strength winners (SCTRs > 80) on the Strong Earnings ChartList (SECL) that are in the materials (XLB) and health care (XLV) sectors and are testing their 20-day EMAs. Over the past 3 months, these two sectors have been the two best performers:
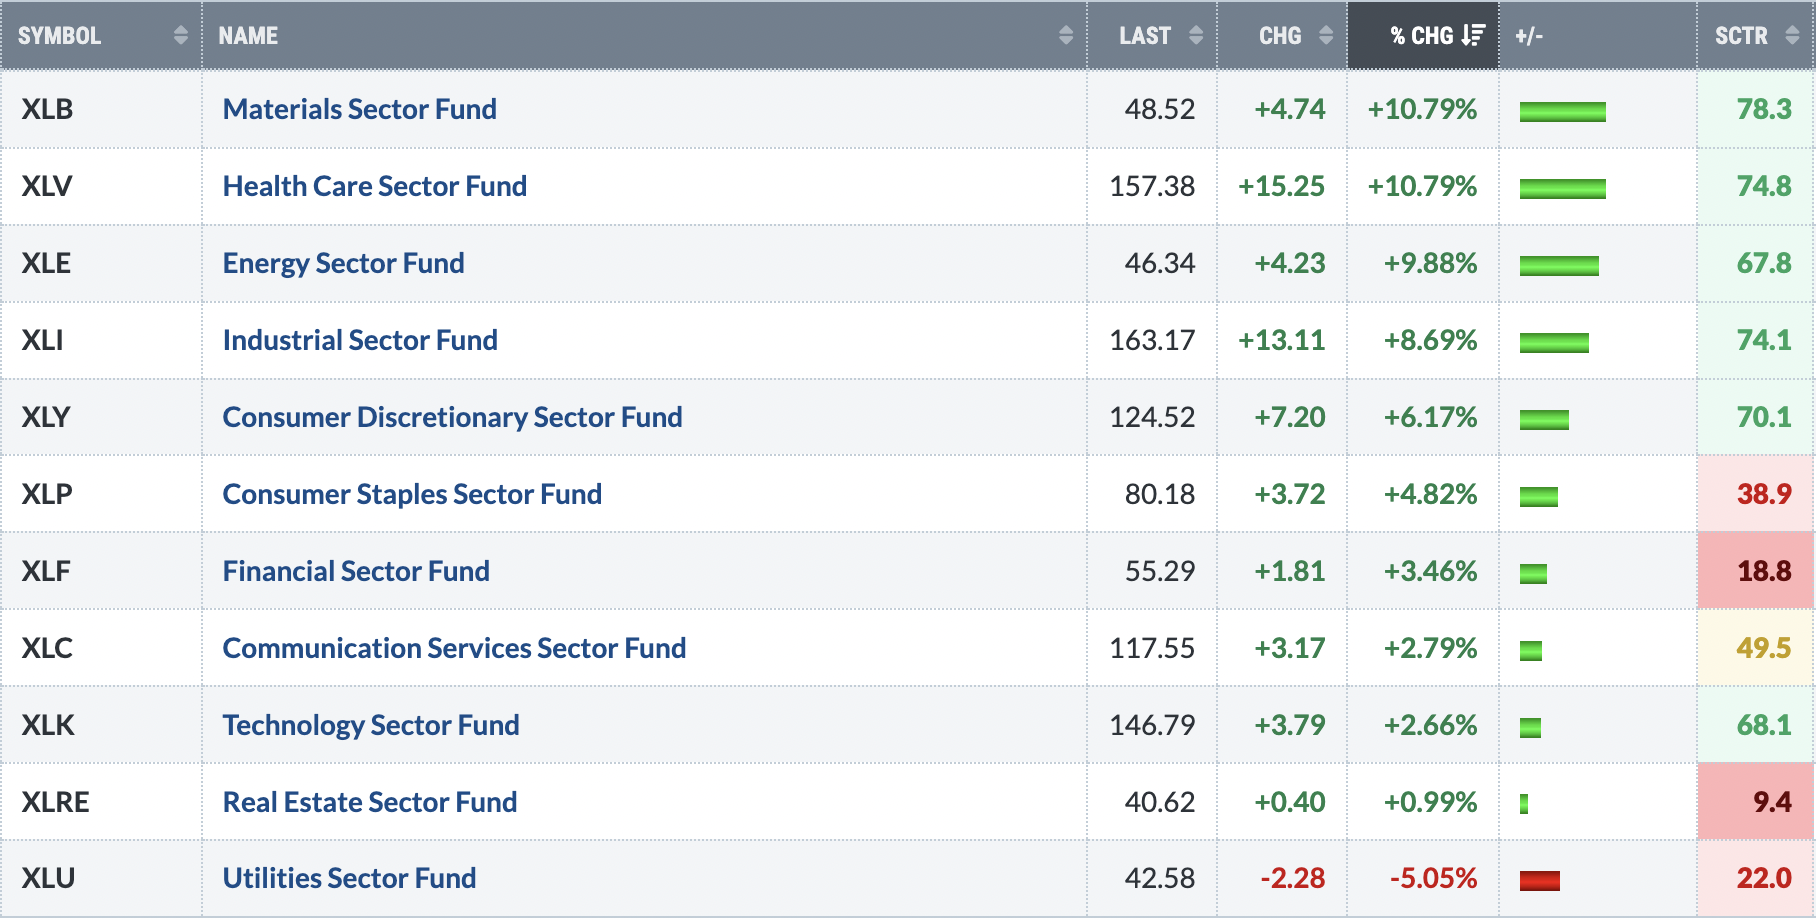
Note that the XLB and XLV have SCTR scores of 78.3 and 74.8, respectively, which rank #1 and #2 among all sectors.
Here's the scan that I ran:
Finally, here are the results of the scan:
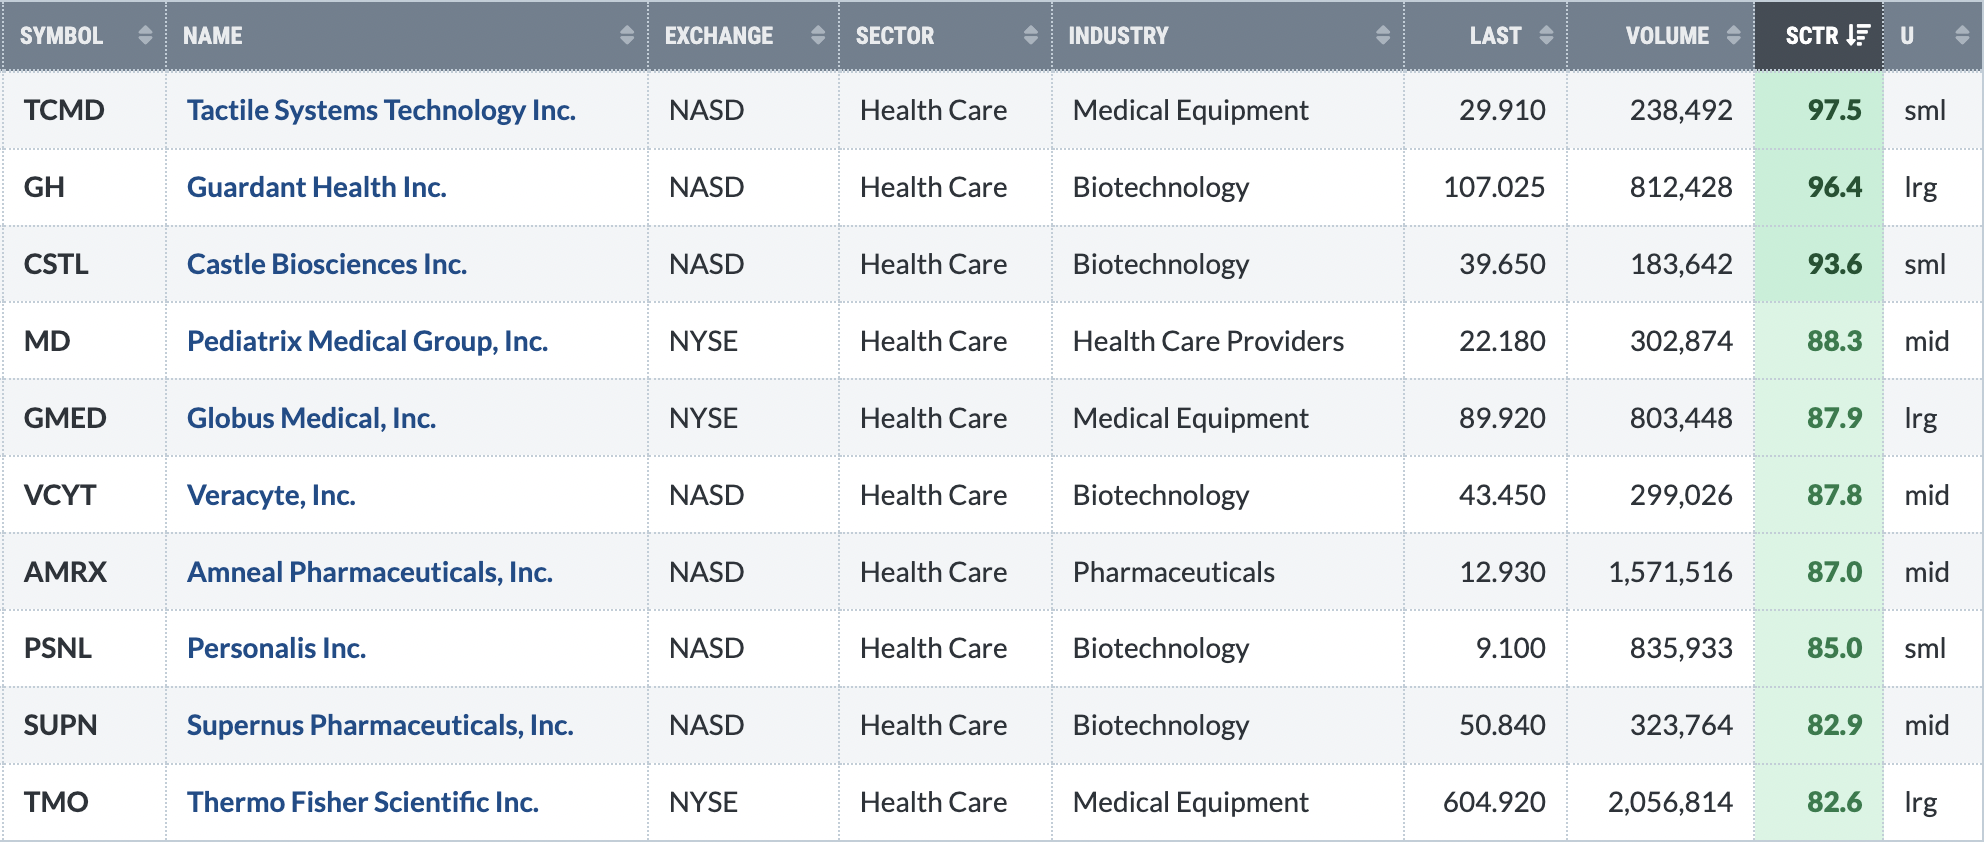
GH looks like it just printed the right side of a cup with its handle testing the 20-day EMA today. A break above 22.80 on MD increases the odds of a move to 25 to form the right side of a cup there. GMED is on its 20-day EMA and it has a strong recent history of bouncing from there. VCYT seems to be consolidating near its 50-day SMA before another push higher. I see another move to 49-50 coming. I love the move down to test the 20-day EMA on TMO. I think I mentioned that one recently - perhaps on my StockCharts video last week?
The scan didn't return any materials stocks. Instead, all 10 came from health care. This type of scan could be run every day so long as the XLB and XLV continue to show sector leadership.
Upcoming Earnings
Our Upcoming Earnings ChartLists and Upcoming Earnings Relative Strength ChartList are included on our website.
Economic Reports
December CPI: +0.3% (actual) vs. +0.3% (estimate)
December Core CPI: +0.2% (actual) vs. +0.3% (estimate)
October new home sales: 737,000 (actual) vs. 710,000 (estimate)
Happy trading!
Tom