
EB Daily Market Report - Thursday, January 15, 2026
Executive Summary
- Futures were higher overnight and our major indices gapped up at the open
- Strong earnings from Taiwan Semiconductor (TSM, +5.18%) boosted the entire semiconductor group ($DJUSSC, +3.10%)
- AI stocks were given a big boost as well, helping to lead growth (IWF, +0.32%) higher
- After an early disadvantage, however, value (IWD, +0.60%) rallied intraday to overtake growth once again
- Meanwhile, Iran-US tensions cooled and crude oil ($WTIC, -4.66%) plunged back near $59 per barrel
- Cryptocurrencies also reversed lower today, as bitcoin ($BTCUSD, -1.78%) will now try to hang onto 95000, its most recent breakout level and now support
- The 10-year treasury yield ($TNX) has remained relatively constant, up 1 basis point today to 4.15%
- The Volatility Index ($VIX, -8.00%) has dropped sharply the past two sessions after briefly touching 18 on Wednesday morning
- Utilities (XLU, +1.29%) and technology (XLK, +1.26%) lead 8 of 11 sectors higher
- Electronic equipment ($DJUSAI, +4.41%) is the best-performing industry group, setting a fresh all-time high in the process
- Health care (XLV, -0.48%) is today's worst-performing sector
Market Outlook
I spoke about the strongest historical period of the year, October 27th close through January 18th close, at MarketVision 2026. The stock market always looks forward and, because this bullish period nearly always closes higher, it helps to set the stage for a bullish year ahead....usually.
One unusual stat that most market participants are not aware of is this: Since 1950 on the S&P 500, this 10/28-1/18 period (consisting roughly of 2 months and 3 weeks, or 22.7% of the year) has produced 50% of the S&P 500 gains. Let that sink in for a second. Less than 23% of the year has produced 50% of the gains since 1950. So it's important to understand, first and foremost, that one of the biggest historical drivers of stock market gains ends tomorrow at the close.
The next thing to understand is that how the S&P 500 performs during this 10/28-1/18 period has been a fairly strong predictor of how the balance of the year is likely to unfold. The 10/28-1/18 period has ended lower than it began only 9 of the past 75 years. When that has occurred in the past, the balance of the year has typically been quite bearish. We started this current 10/28-1/18 period at 6875 and, currently, the S&P 500 is at 6955. Barring a big drop in the final hour or two today plus tomorrow, we should at least remain in positive territory (above 6875), which is good. However, we are still likely to finish in the Bottom Quadrant (25%) of 10/28-1/18 periods, which usually carries with it a lot more uncertainty about prospects for the year ahead.
While this guarantees us nothing, it does add one more cautious signal to a plethora of others that I've been discussing since early December.
Sectors/Industries
Some energy stocks failed after a very solid advance to begin 2026. In particular, and during our Live Trading Room on Wednesday, I mentioned Devon Energy (DVN) as a potential breakout candidate within the energy space. I pointed out the importance of CLOSING above its key breakout level at 38.00, not just trading there on an intraday basis. Take a look at how DVN failed to hold its breakout into the close on Wednesday and the selling that took place today after that foiled attempt at a breakout:
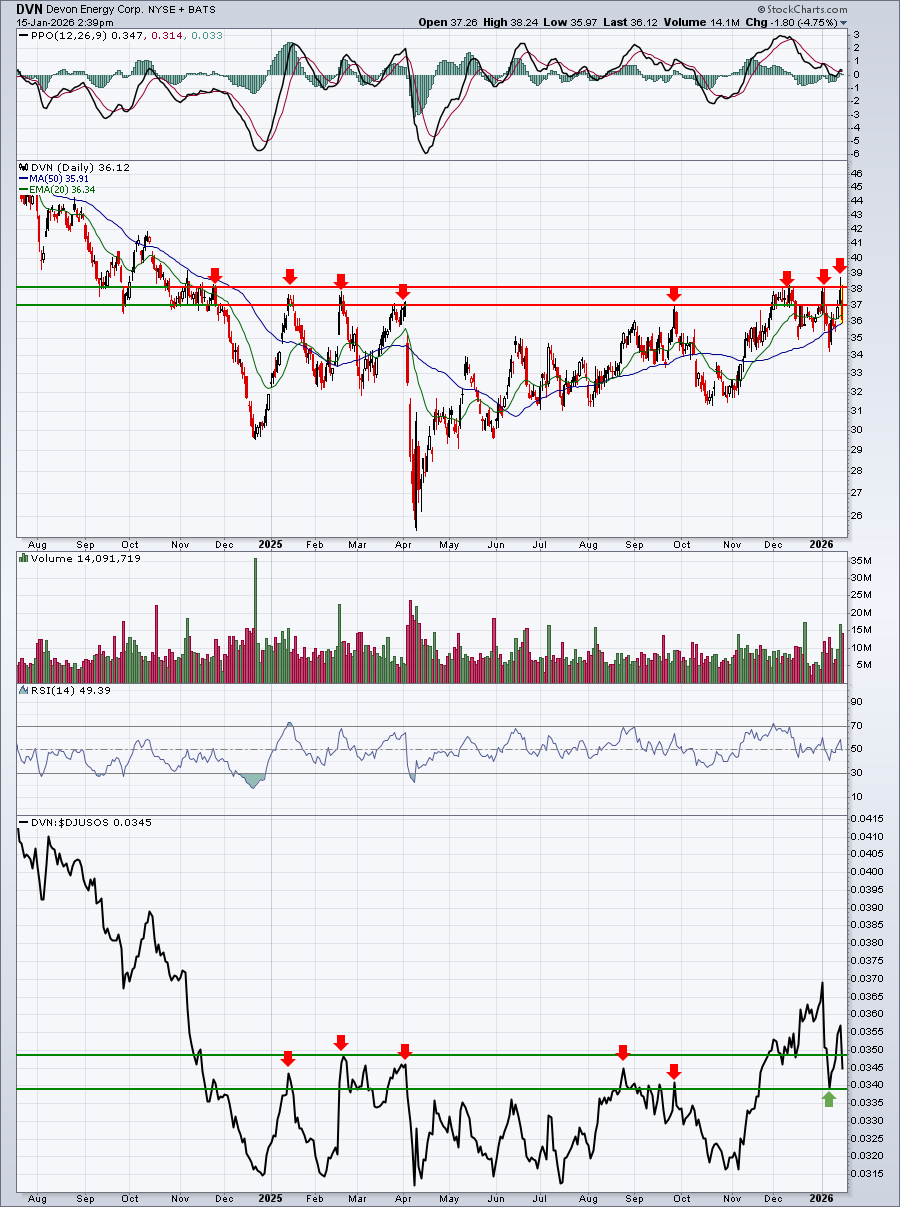
On the failure, I liked a potential pull back to test the now-rising 20-day EMA (36.37), which DVN tested today. The bottom panel shows that DVN has begun to show some relative strength in recent weeks. Because this is more of a value-oriented trade and the stock market has been favoring value stocks, I have a higher degree of confidence in it. A potential second entry could be considered on a 50-day SMA test, currently at 35.92. If a trade is entered, any close below 34.47 might be considered for a fairly tight stop.
ChartLists and Trading Strategies
Every quarter, I evaluate the health of stocks heading into their respective earnings reports by the amount of relative strength (or relative weakness) they show. The big Wall Street firms meet with company management teams throughout the quarter and determine whether a company is meeting its objectives and performing well vs. its peers. They then return to their offices and these big firms either buy or sell these companies based on their meetings and discussions. The way that we can be a "fly on the wall" for these meetings is by following Wall Street's money and the relative strength of individual stocks. If a company shows excellent relative strength heading into its earnings report, I look for solid quarterly reports. The opposite is true for companies that are showing weak relative performance vs. its peers.
As I look ahead to next week's earnings slate, here are 2 stocks that I like and 2 that I don't based on their current relative performance:
Stocks I like:
TEL:
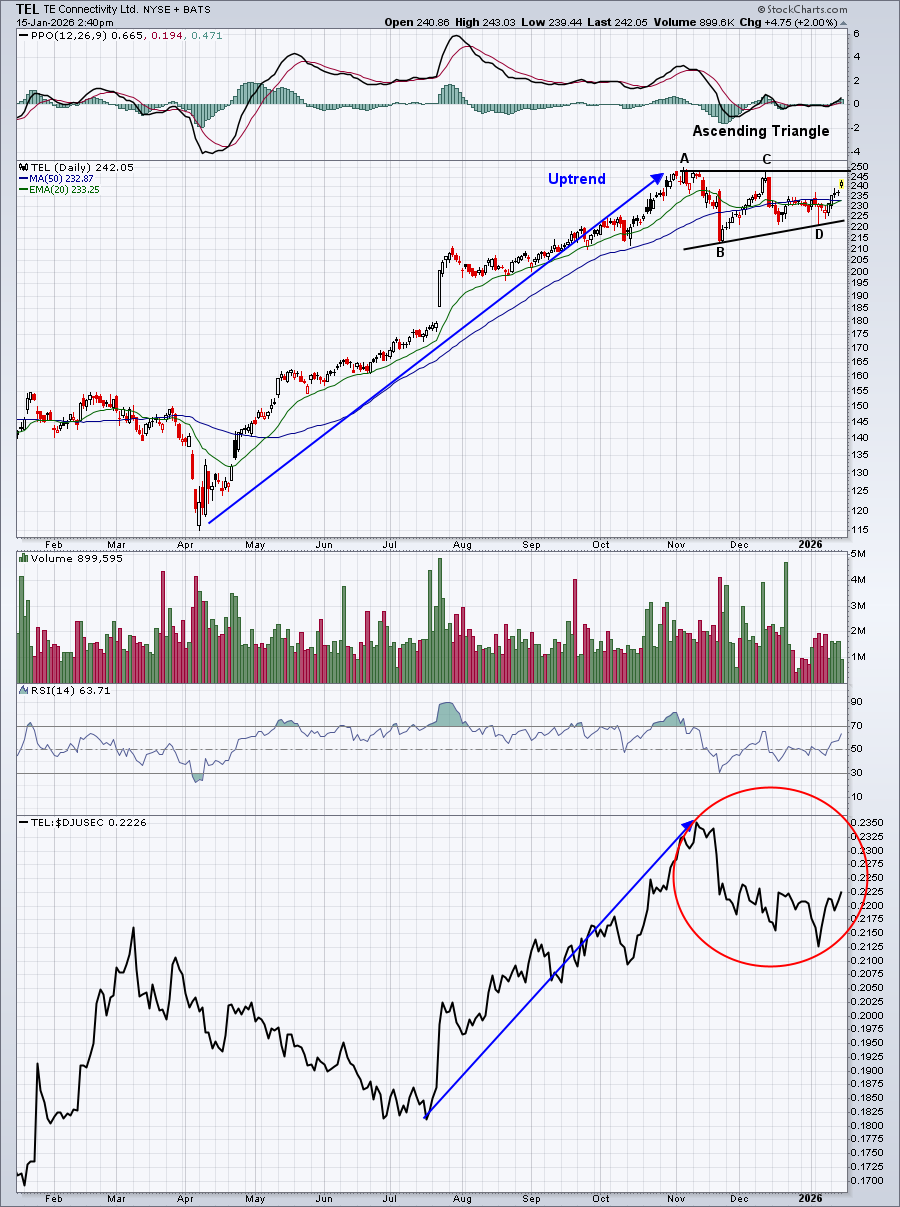
TEL showed considerable strength through early November, prior to consolidating in a bullish A-B-C-D-E ascending triangle continuation pattern. We've yet to see the "E", which is the breakout of the pattern. That could occur with a strong earnings report next week. We'll see.
GE:
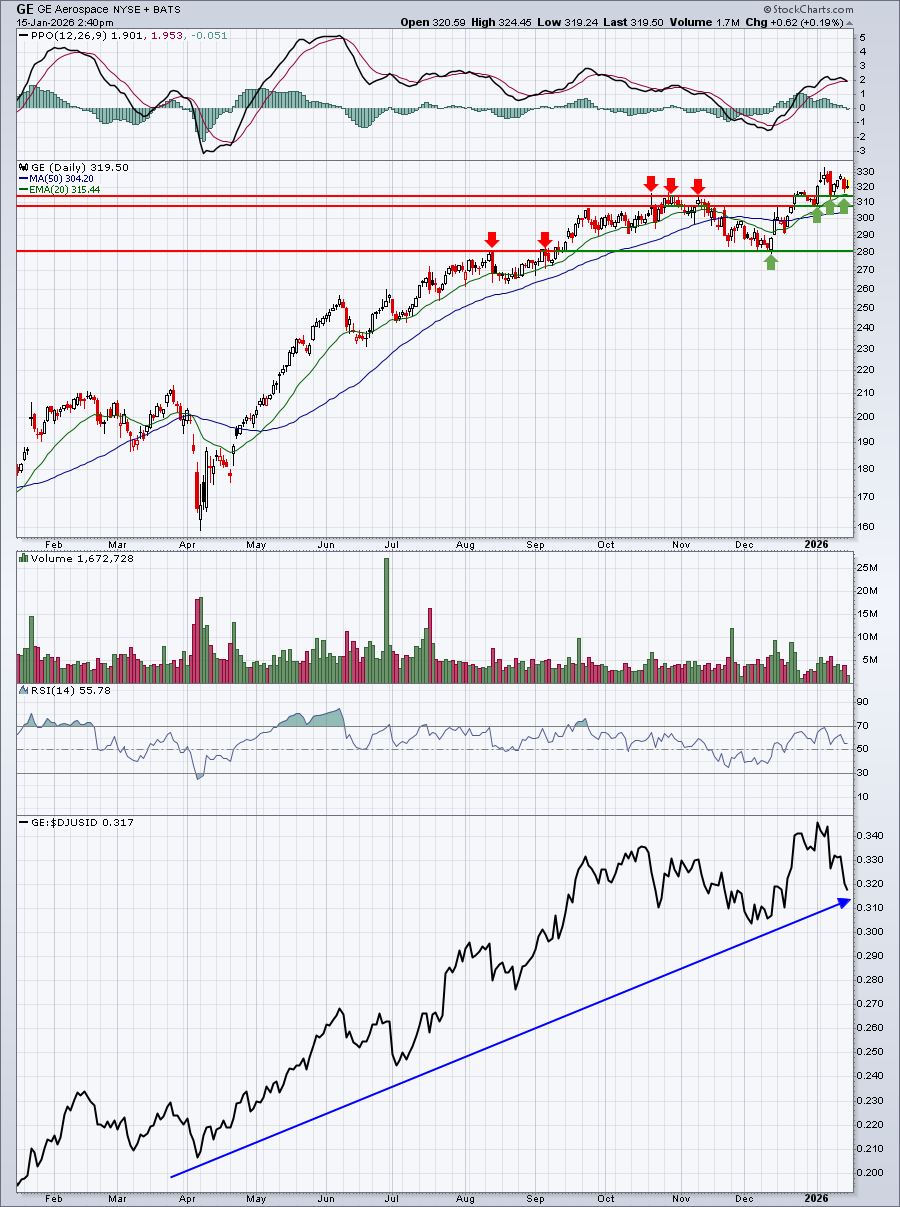
GE has been a very consistent outperformer since the end of the nasty cyclical bear market in 2022. So it's been just over 3 years now of very solid performance. I don't see any let up just yet. Now that it's broken out again, I'd be fine holding onto GE as long as it trends above its rising 20-day EMA.
Honorable mentions: COF, ORI, ACMR, CMA
Stocks I don't like:
NFLX:
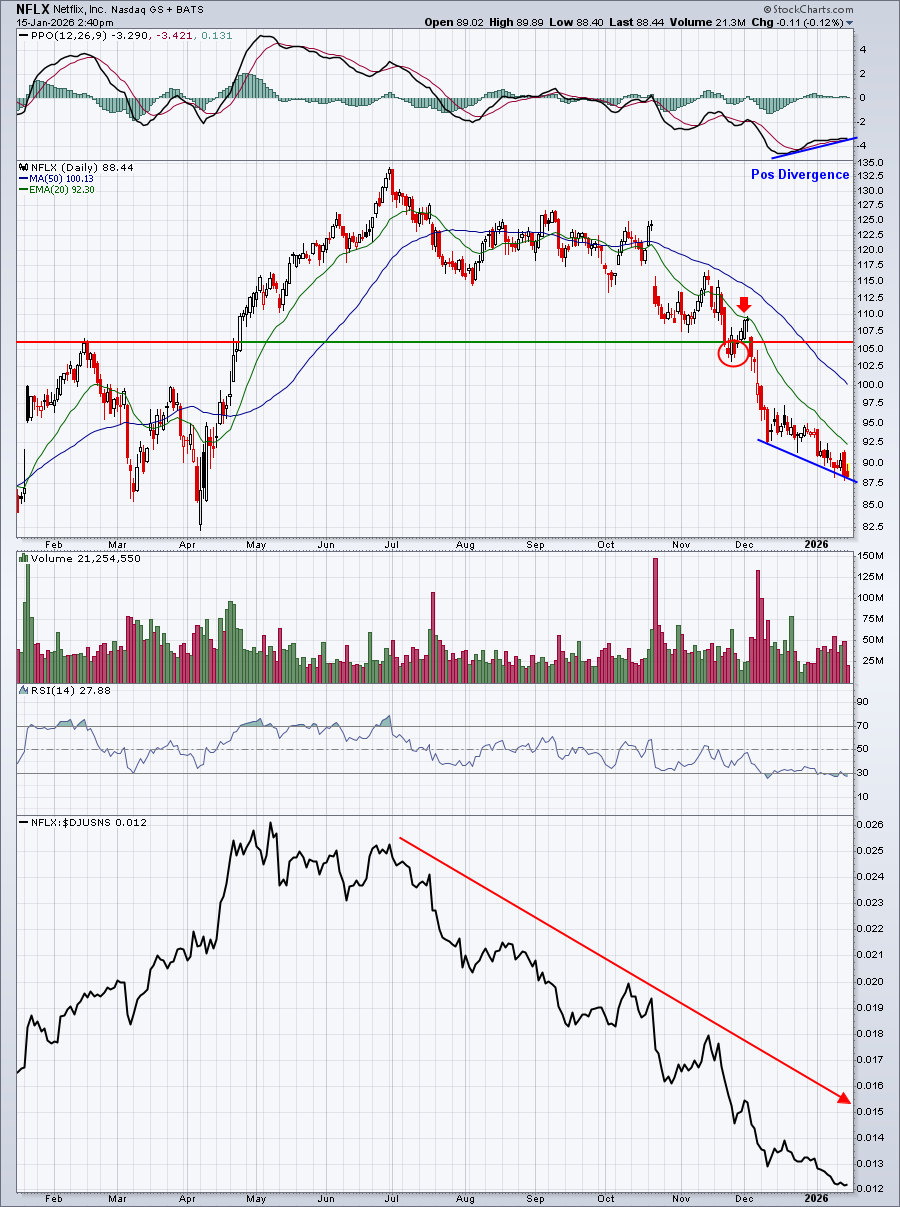
I don't like betting against Netflix (NFLX) for a couple reasons. First, it's been a great long-term performer, both on an absolute basis and relative basis. Second, it has a seasonal history of performing extremely well during the month of January. But, at the same time, I don't want to be blind and ignore potential warning signs. NFLX has been downtrending on an absolute basis since June and also vs. its internet peers ($DJUSNS) since May. While that guarantees us nothing in terms of its quarterly results, it does, in my opinion, increase the risk of a poor report.
If I'm right about a not-so-good quarterly report, I think it's very possible that NFLX gaps lower, but then sees a lot of buying as the positive divergence in play suggests that selling momentum is waning. Outside of a potential gap lower, I expect a recovery to the 50-day SMA sometime fairly soon to "reset" the PPO back to its centerline.
FAST:
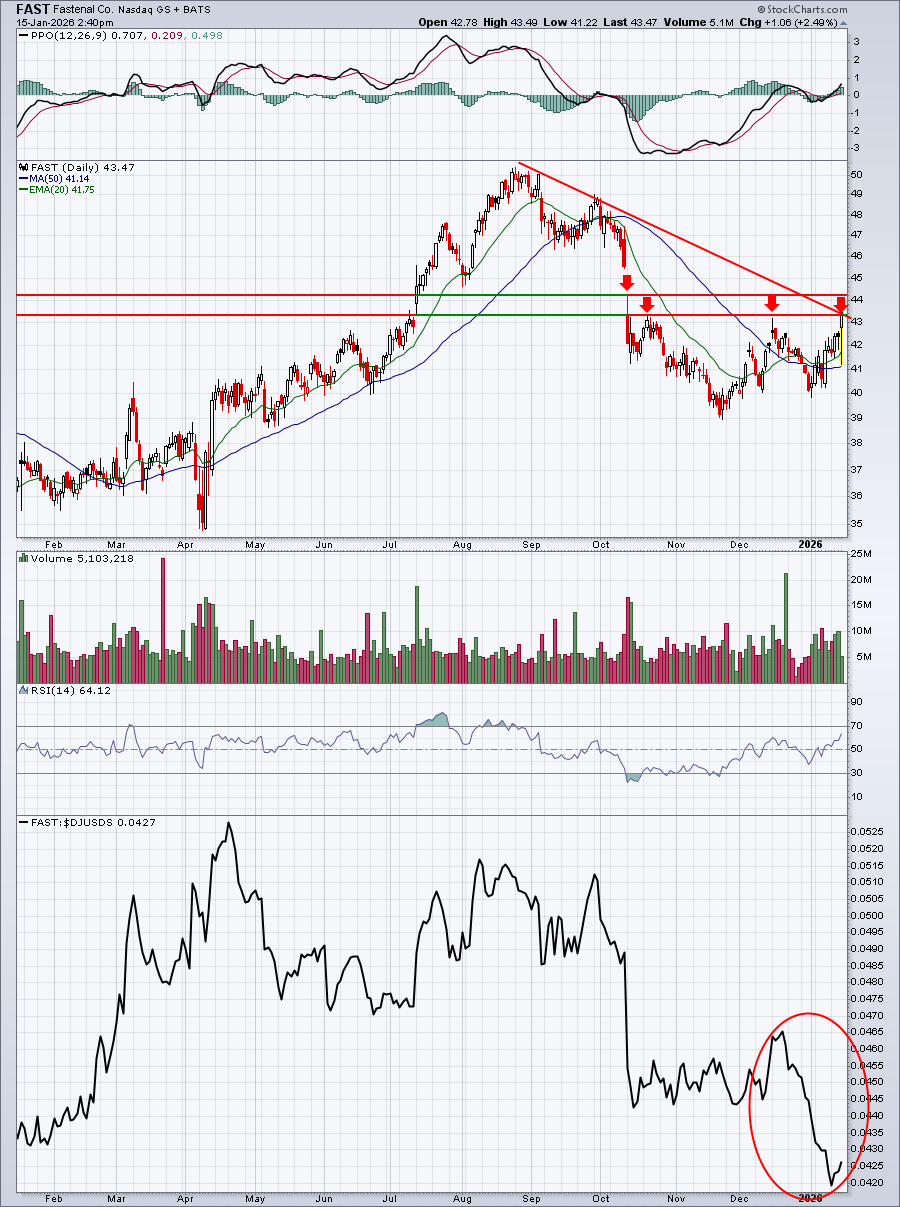
FAST has a reached a very important pivot point on its chart. There's a ton of overhead gap and price resistance present and it's also intersecting its downtrend resistance line. Given the very poor relative strength, my guess is that the next big move here is going to be lower - that is, unless management has been hiding good news from Wall Street firms.
Honorable mentions: ABT, MBLY, ALK,
Upcoming Earnings
Our Upcoming Earnings ChartLists and Upcoming Earnings Relative Strength ChartList are included on our website.
Economic Reports
Initial jobless claims: 198,000 (actual) vs. 215,000 (estimate)
January empire state manufacturing survey: 7.7 (actual) vs. 1.0 (estimate)
January Philadelphia Fed manufacturing survey: 12.6 (actual) vs. -4.5 (estimate)
Happy trading!
Tom