
EB Daily Market Report - Thursday, January 22, 2026
Weather Update
The entire EarningsBeats.com team lives in the Carolinas - both North and South Carolina. There is a major winter storm heading our way that could unleash a very significant amount of ice from late Saturday through Monday. Worst-case scenarios could result in power outages that significantly impact our business at EB. We are trying to catch up all ChartLists through Thursday morning earnings and have those available (for viewing and/or download) to members by Saturday morning. That is the plan.
It's very possible that many of our services could be delayed by extended power outages. We will do our best to keep you updated over the weekend and into early next week, so that you can plan accordingly.
Executive Summary
- Futures were higher overnight and our major indices gapped up
- Price action has moved back above key 20-day EMAs and 50-day SMAs on many key indices, underscoring the trendless market environment that we're enduring
- We've now filled most gaps from the Tuesday opening-bell selling, with the most significant recovery in the small cap Russell 2000 (IWM, +1.09%)
- Today's strength is perhaps the best we've seen recently as our 3 aggressive sectors lead - XLC (+1.46%), XLY (+1.22%), and XLK (+0.93%)
- Automobiles ($DJUSAU, +3.42%), telecom equipment ($DJUSCT, +2.91%), and internet ($DJUSNS, +2.18%) are among industry leaders
- This "risk on" environment is not carrying over to cryptocurrencies, however, as etherium ($ETHUSD, -2.79%) leads most cryptos lower
- Silver ($SILVER, +3.99%) and gold ($GOLD, +1.79%) are leading again, with the latter now nearing $5000 per ounce
- Crude oil ($WTIC, -2.23%) is down and back below $60 per barrel; energy (XLE, +0.24%), however, has remained positive today
- Earnings saw mixed results with Northern Trust (NTRS, +6.04%) gaining, while General Electric (GE, -5.71%) lost ground; both beat revenue and EPS estimates
Market Outlook
Any time I see market action swinging back and forth above, and then below, key moving averages, it's a reminder that we're not trending in either direction. Instead, we're simply in a consolidation range. I'd consider the S&P 500 to be consolidating as long as it remains in this range:
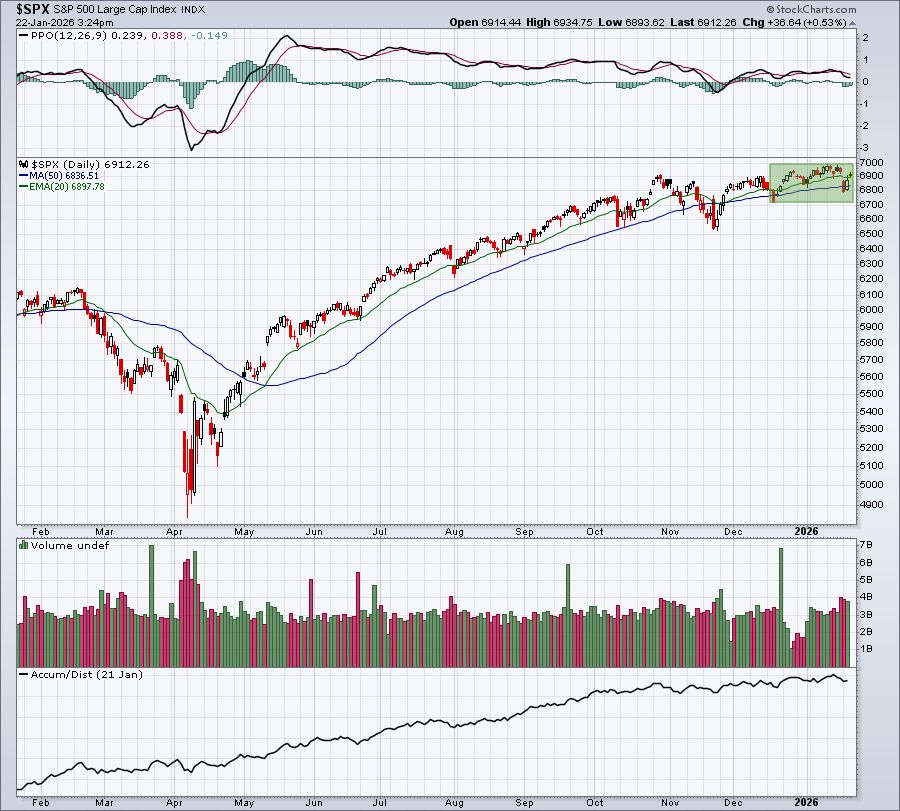
The all-time high of 6986.33 serves as key price resistance, while the December 17th low of 6720.43 marks key price support. This is roughly a 4% range that the S&P 500 has traded in now for the past 5 weeks or so.
Sectors/Industries
I'm a fan of energy (XLE) and materials (XLB) over the next few months. I continue to see overall topping signals for the S&P 500 and, in prior difficult periods, the XLE and XLB have benefited from significant rotation. That very well could occur again in 2026.
Furthermore, take a look at the seasonal charts for both throughout this secular bull market, focusing on the relative strength of each during the February to April period:
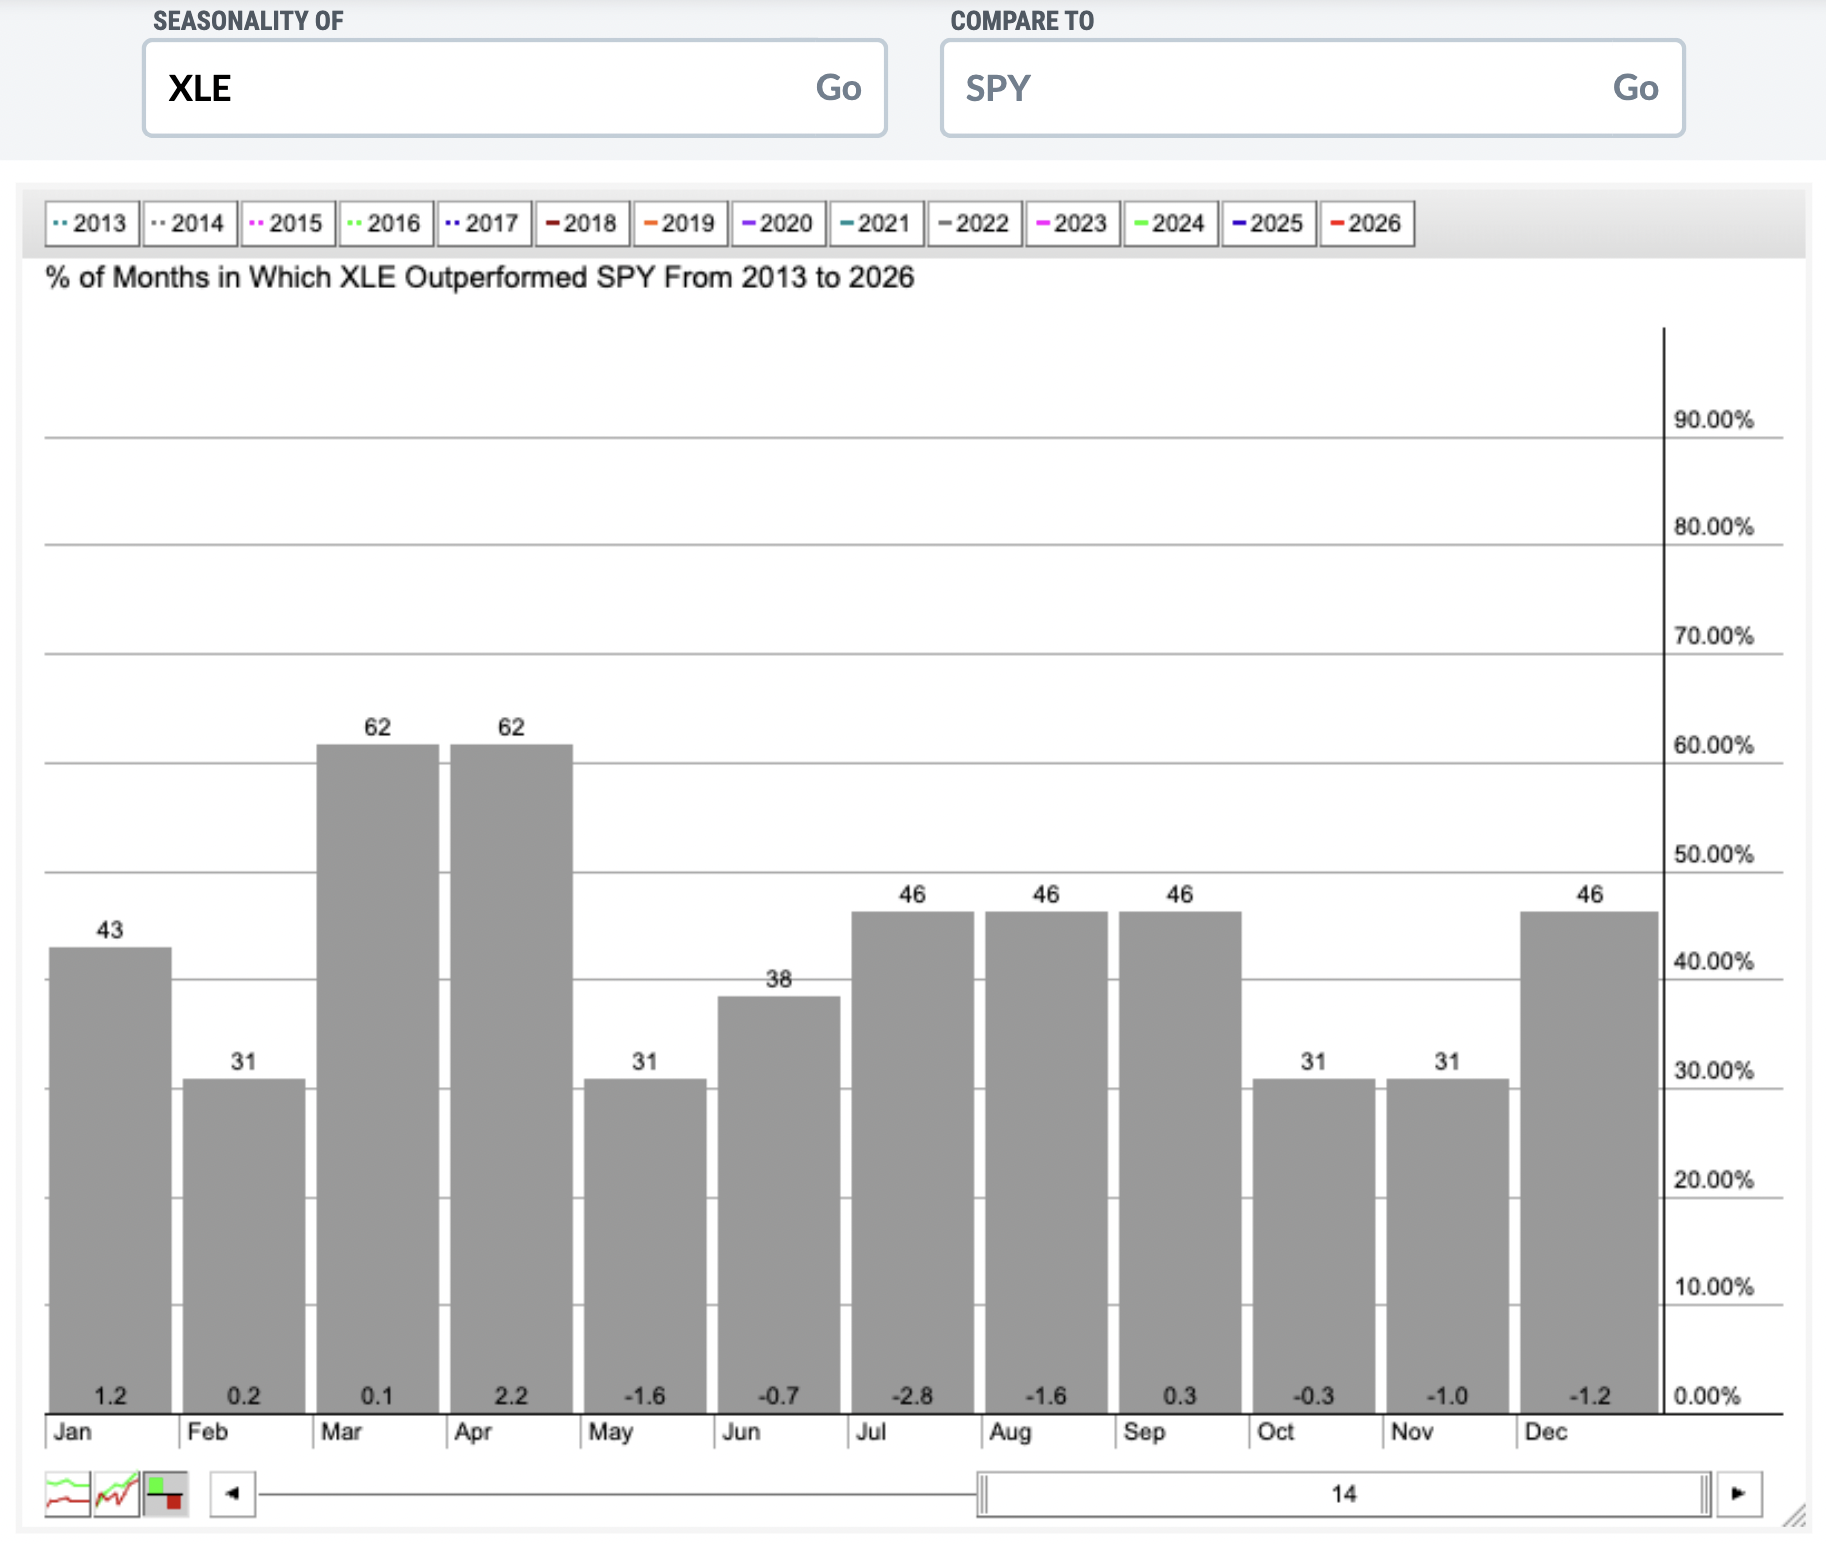
You can see at the bottom of each month's column the "average monthly outperformance vs. the SPY over the past 14 years". It's rather clear that energy does well on a relative basis in the January through April period, much better than the rest of the year.
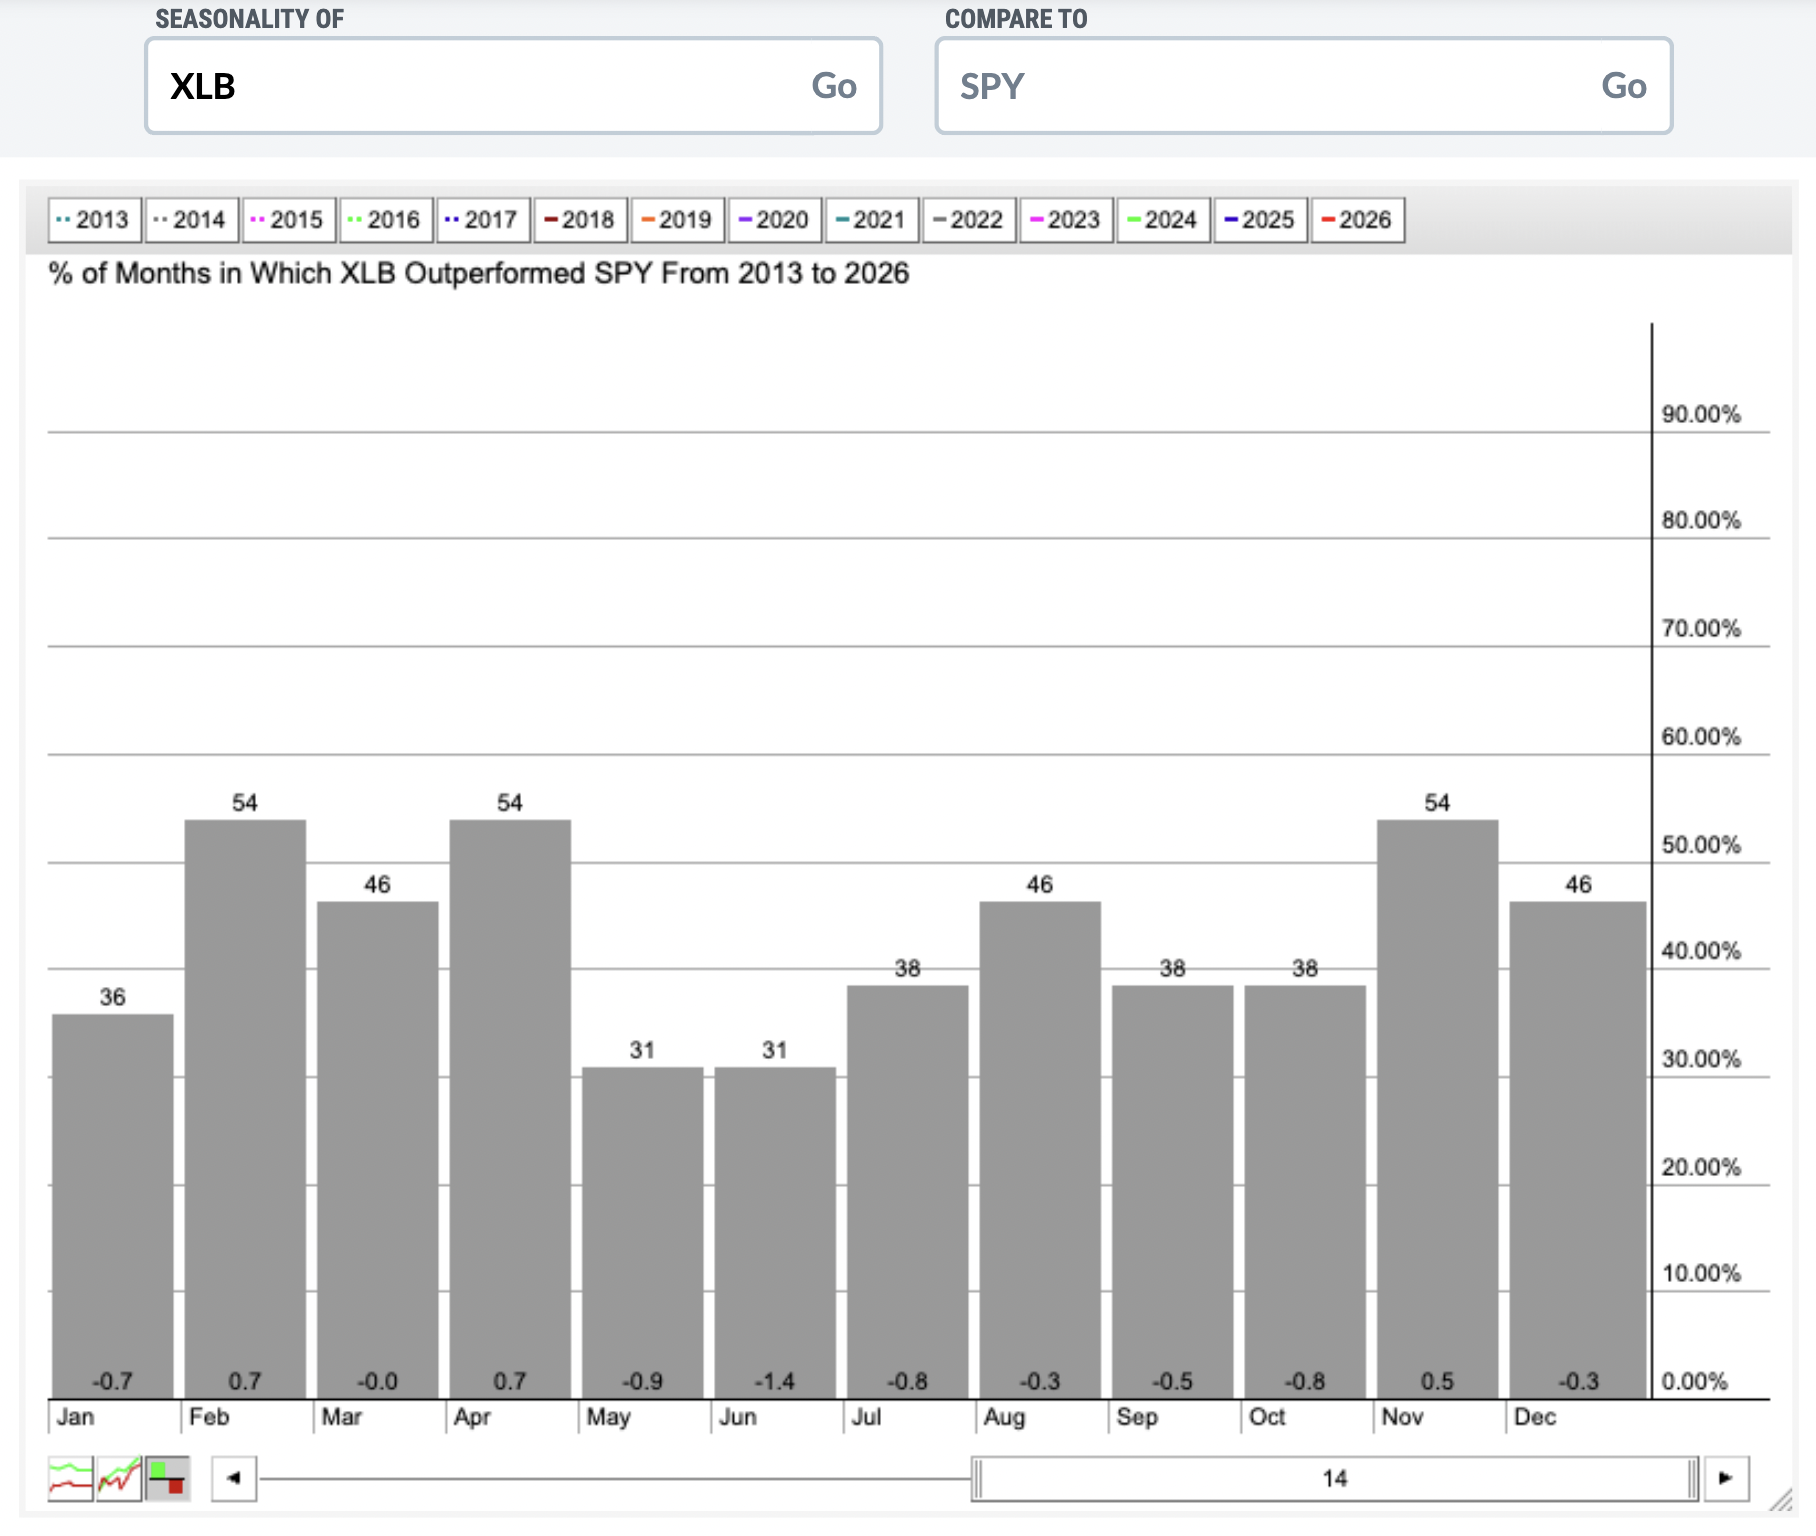
The XLB's relative performance isn't quite as strong as the XLE's, but the XLB's best 3-consecutive-month period of relative strength is February through April.
If we do see continuing rotation away from growth stocks throughout Q1, I would expect to see energy and materials benefit.
ChartLists and Trading Strategies
Here is an energy stock and a materials stock that could benefit from further relative strength in these two sectors:
PUMP:
I love the huge volume and gap up back in late October. PUMP has since been consolidating. I either like it back towards the bottom of its recent trading range OR on a breakout above 11.50:
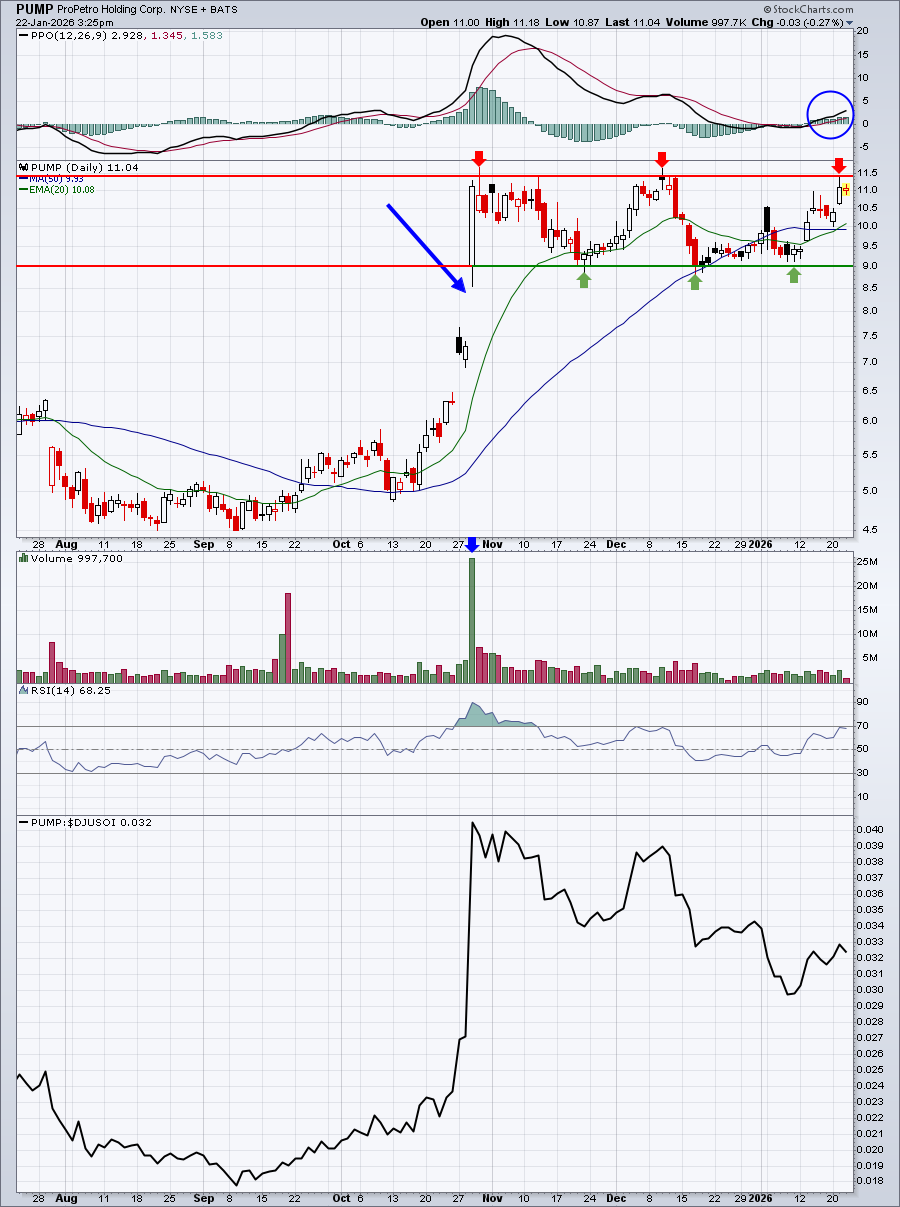
The PPO is just starting to turn higher off its centerline support. A price breakout could begin a very powerful rally.
CLMT:
Here's one consolidating in a very bullish ascending triangle continuation pattern. Is it making the breakout today?
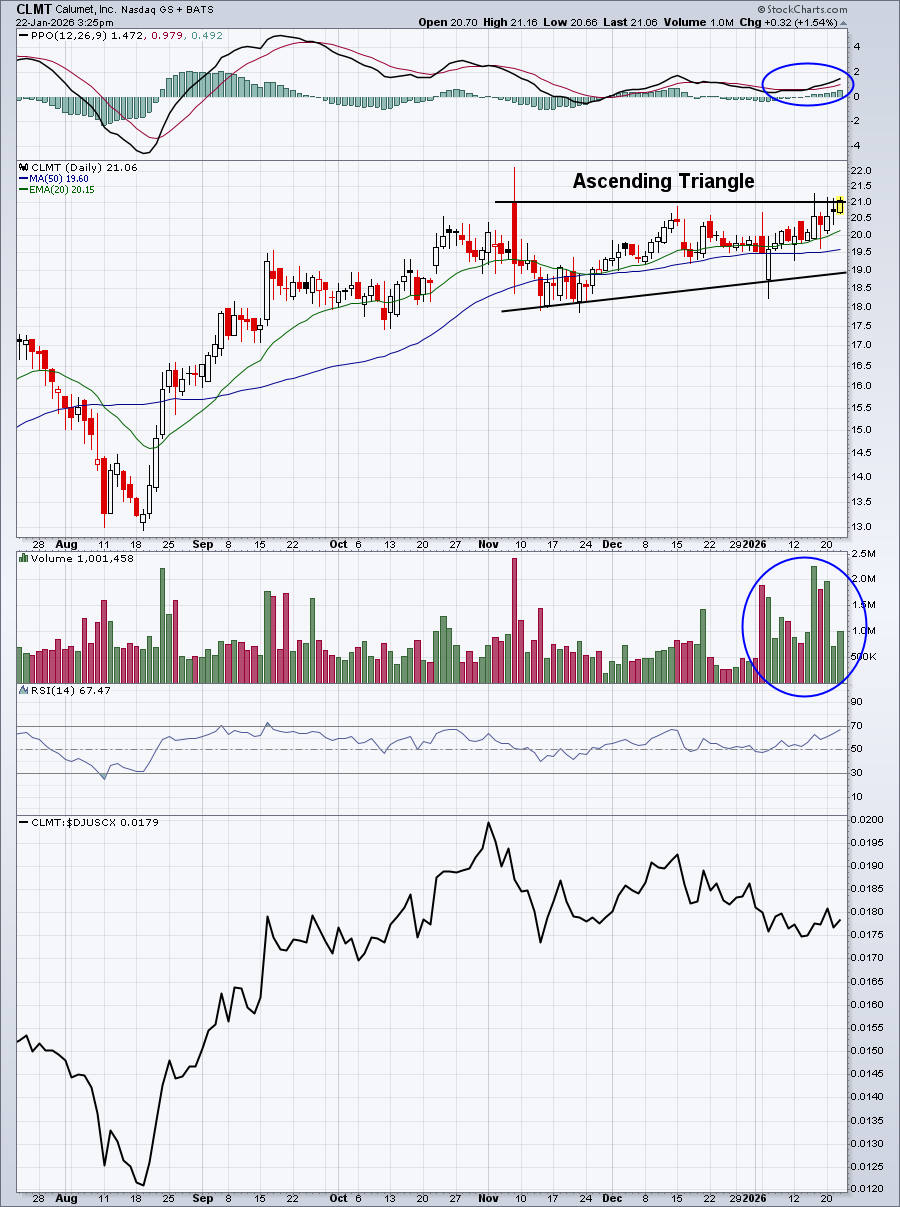
Again, we see the PPO slightly above the centerline and rising, indicative of increasing bullish momentum. A pattern breakout would only add to the bullishness. Furthermore, volume trends here are very solid. The AD line here (not pictured above) is quite bullish as well, suggesting possible accumulation.
Upcoming Earnings
Our Upcoming Earnings ChartLists and Upcoming Earnings Relative Strength ChartList are included on our website.
Economic Reports
Initial jobless claims: 200,000 (actual) vs. 208,000 (estimate)
Q3 GDP: 4.4% (actual) vs. 4.3% (estimate)
November personal income (delayed): +0.3% (actual) vs. +0.4% (estimate)
November personal spending (delayed): +0.5% (actual) vs. +0.5% (estimate)
November PCE index (delayed): +0.2% (actual) vs. +0.2% (estimate)
Happy trading!
Tom