
EB Daily Market Report - Thursday, February 5, 2026
Executive Summary
- Futures were weak overnight and our major indices gapped lower today
- Alphabet (GOOGL, -0.90%) has recovered much of its early losses, but it's still another Mag 7 stock that mostly failed to impress
- Amazon.com (AMZN, -4.39%) will be reporting after the close today
- Bitcoin ($BTCUSD, -13.09%) is leading a tumbling group of cryptocurrencies after failing to hold critical support at 74,000
- Recently red-hot commodities are falling as well, with silver ($SILVER, -12.10%) leading to the downside
- Crude oil prices ($WTIC, -2.72%) are approaching $63 per barrel, weighing on the energy sector (XLE, -0.91%
- Materials (XLB, -2.40%) and consumer discretionary (XLY, -2.10%) are the primary laggards today, though 9 of 11 sectors are down
- The 10-year treasury yield ($TNX) is down 8 basis points to 4.20% after a big unexpected rise in initial jobless claims this morning
- Medical supplies ($DJUSMS, +11.65%) are jumping after strong earnings reactions from Cardinal Health (CAH, +10.02%) and Align Technology (ALGN, +9.52%)
- Estee Lauder (EL, -20.98%) is the worst performer on the S&P 500 after posting its quarterly results, obviously disappointing Wall Street
Market Outlook
Throughout all the warning signals that I've discussed since early December, the one key to any potential decline is an absolute breakdown in our major indices. The combination of price and volume is ALWAYS my #1 indicator. It's much more important than intermarket relationships, sustainability ratios, the VIX, equity only put call ratio, channels, etc. All the warning signs tell us to watch for that price breakdown as confirmation of all the earlier signals.
Currently, the S&P 500 is testing its most recent price support level:

I don't see any significant breakdown yet. 6796 is the first support level, which we broke beneath earlier today, but we've since rallied back above it. So I'm looking at the current trading range to be 6796-7002. Let's see which level breaks first.
Sectors/Industries
Technology (XLK) is the key to our major indices, because this sector represents such a large percentage of those major indices. On the S&P 500, the XLK is over 33% of the entire index. So.....as goes technology.....likely so goes the S&P 500. Here's what the current technical outlook is for the XLK:

Like the S&P 500, it's all about where we close. I'd say the XLK has very significant price support in the 134-136 zone. Should we fail to hold this support area on a closing basis, it's very likely the S&P 500 would lose that key initial 6796 support level, confirming many of the warning signals that I've been discussing.
ChartLists and Trading Strategies
So long as the price support holds above, we should at least consider the possibility of a quick bounce in our major indices. If that were to occur, some high SCTR stocks off of our key ChartLists could represent solid reward-to-risk trades in the very near-term.
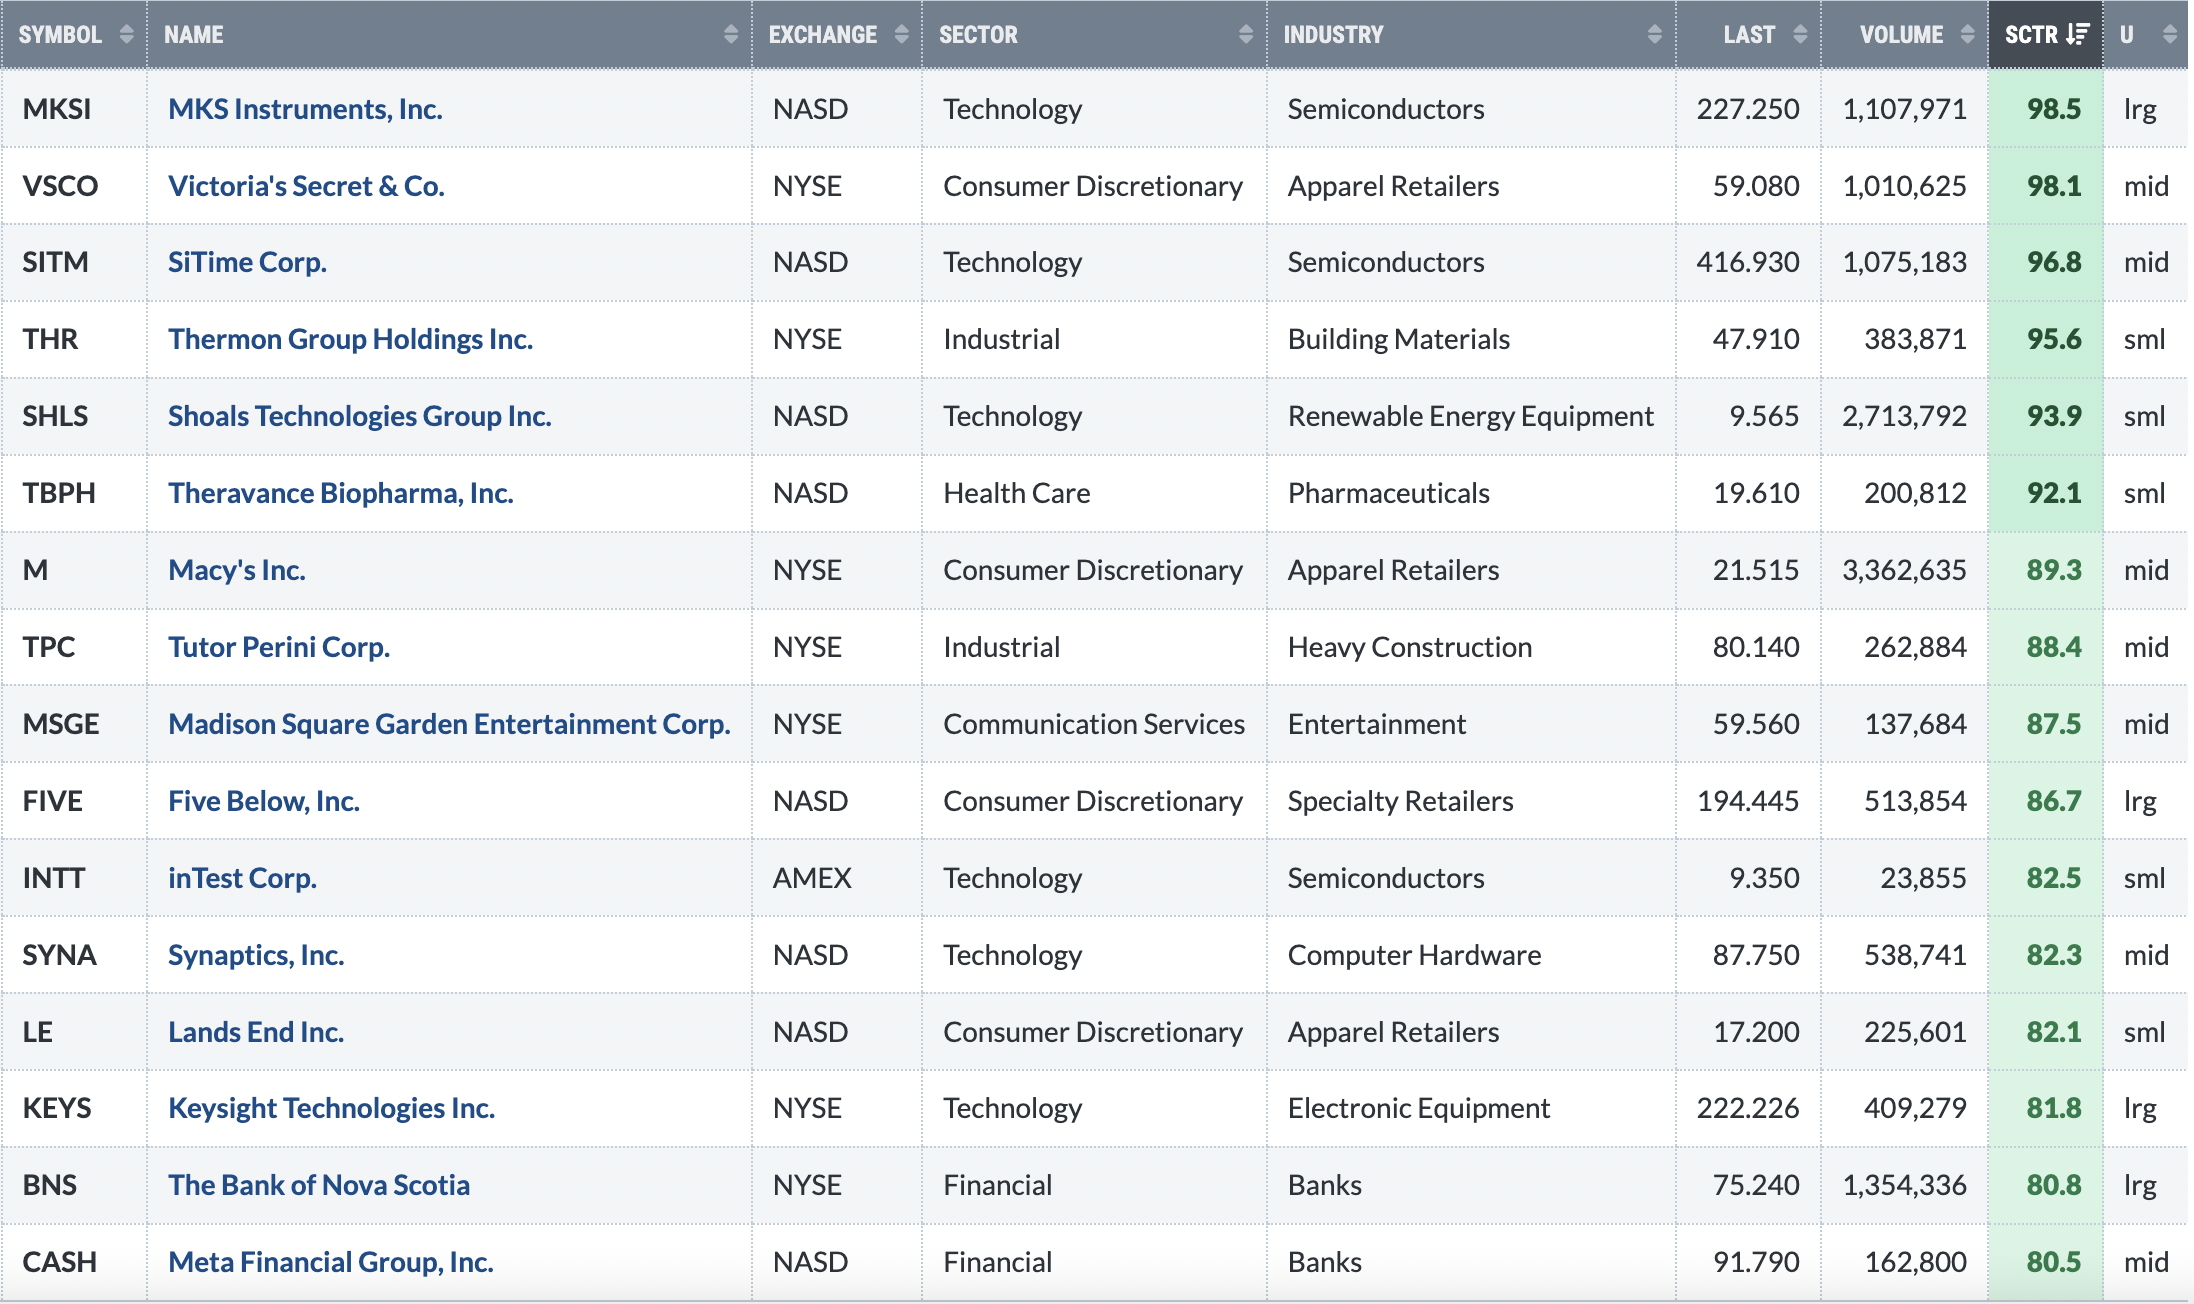
I just ran a 20-day EMA test scan (one of our predetermined scans on our website) vs. our SECL and RGCL, with SCTR scores at 80 and above. Here were the stocks returned:
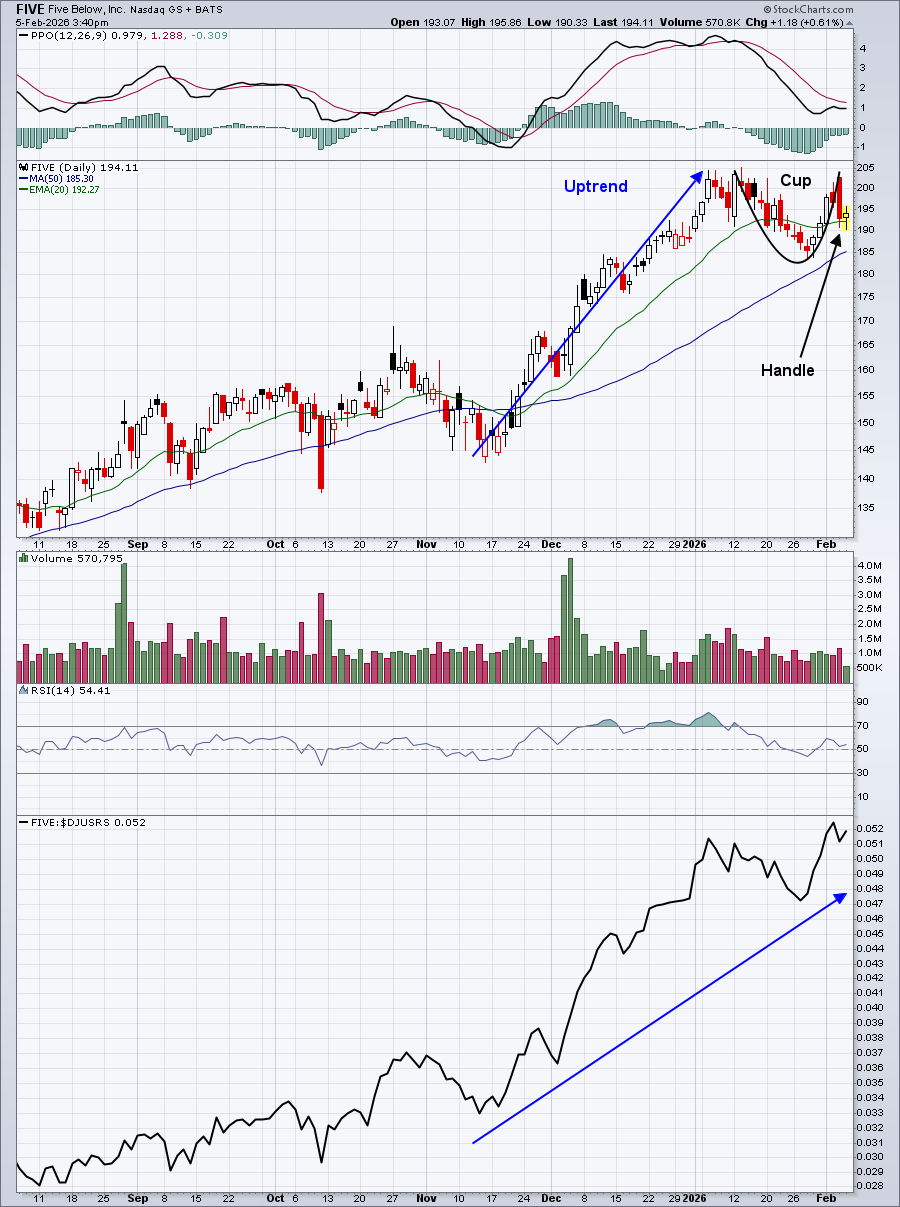
FIVE's set up is interesting as it appears to have printed a bullish continuation cup with handle pattern:
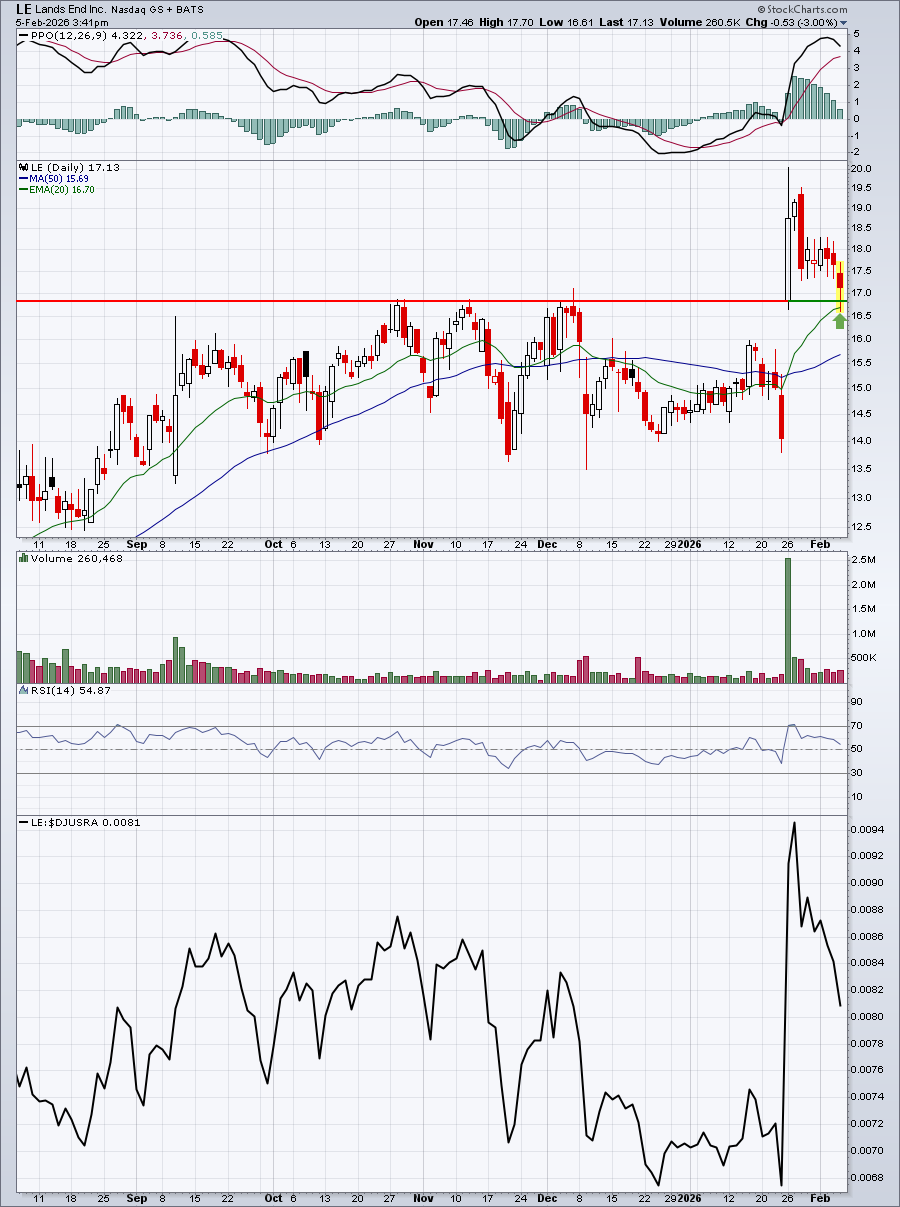
LE is testing its 20-day EMA, while at the same time testing the top of gap support:
Upcoming Earnings
Our Upcoming Earnings ChartLists and Upcoming Earnings Relative Strength ChartList are included on our website.
Economic Reports
Initial jobless claims: 231,000 (actual) vs. 212,000 (estimate)
December JOLTS: 6,500,000 (actual) vs. 7,100,000 (estimate)
Happy trading!
Tom