
EB Daily Market Report - Brief Update - Tuesday, February 10, 2026
The delayed January nonfarm payrolls report was released this morning and, quite honestly, the numbers reported were nirvana for U.S. stocks. As I mentioned on my Trading Places Live YouTube show this morning, it was kinda like a Goldilocks scenario - remember where the baby bear's porridge in the story of the 3 bears was "not too hot, not too cold, but justttt right".
Stocks aren't exactly flying higher, but they're hanging onto recent gains and the
S&P 500 is up 0.18% (at last check), trading at 6977 and just below the psychological 7000 level. 8 sectors are higher, while just 3 are lower. The S&P 500 would be doing better, but its largest sector - technology (XLK) - is up just 0.3%, so that group continues to hold back both the S&P 500 and NASDAQ 100, the latter of which is higher by just 0.14%. Still, it beats the alternative of falling prices.
The big question I have now that earnings season is almost over? What's the near-term catalyst going to be to take stock prices higher? Since 1950, S&P 500 performance has historically tailed off considerably during the second half of calendar quarters Q1, Q2, and Q3. One of the more bearish historical periods begins next week, from February 16th through February 23rd. The annualized return for this period is -21.24% on the S&P 500 since 1950. It doesn't get any better for the NASDAQ as its annualized return is -43.67% since 1971. If you're looking for seasonal strength in small caps, that won't work either. The small cap Russell 2000 has produced annualized returns of -50.89% since 1988.
Please don't read this literally. It doesn't mean that stocks collapse every year during this upcoming week. It simply suggests the "tendency" for prices to pull back starting next week.
I did a lot of research over the weekend and into yesterday, studying periods where the technology sector (XLK) has faltered to see how the S&P 500 had fared during those and subsequent periods. I wanted to try to make some sense out of when a poor-performing technology group leads to further losses and when it simply turns out to be just temporary rotation and what could be the difference. For the most part, and as I suspected, the S&P 500 struggled when technology weakened on a relative basis. That makes common sense as the XLK has been roughly 30%-35% of the S&P 500 throughout much of the current secular bull market run.
There's a lot going on in this chart, but check out this 15-year chart of the relative strength of technology that also includes both absolute and relative performance of industrials (XLI) and financials (XLF):
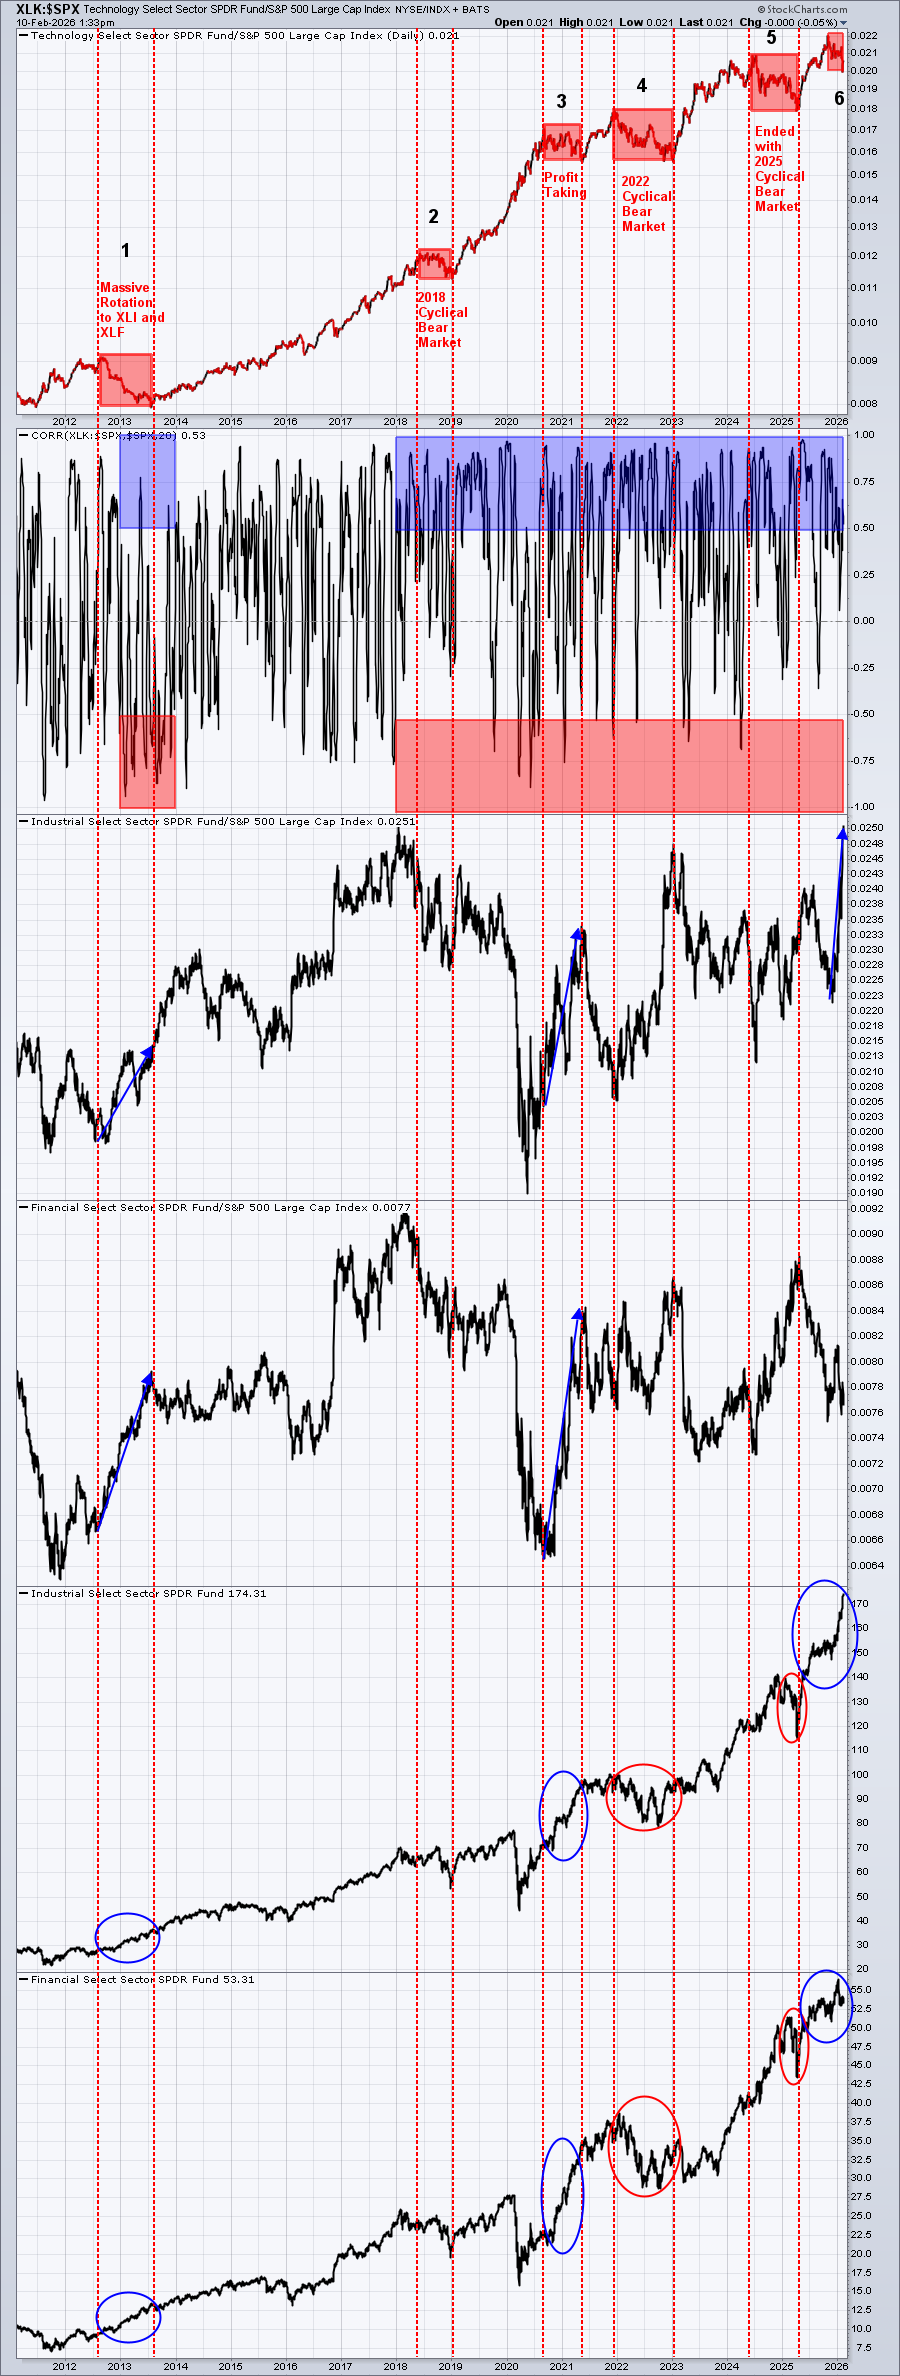
I found that there's been extended relative weakness in technology 6 times since this secular bull market was confirmed in April 2013. 3 of the previous 5 times resulted in cyclical bear markets - 2018, 2022, and 2025.
One thing stood out to me. During each of the bear markets, industrials and financials lost ground on an absolute basis. In other words, they may have shown relative strength (which is fairly easy to do if technology is falling), but they did not show absolute strength. This tells us that money leaving technology was not rotating into industrials and financials. Rather, it was simply leaving the market.
Check out the performance of industrials and financials in 2013 and again in 2020/2021. Industrials and financials both performed well and continued moving higher on an absolute basis. In these two instances, money did rotate into two "aggressive value" sectors and the S&P 500 never morphed into a correction or a bear market.
As I look at this 6th time that technology is underperforming, I see industrials and financials both performing very well on an absolute basis, adding confidence to the market that a bear market is NOT imminent.
In my opinion, we would need to see a lot of weakness in industrials and financials for me to even consider the possibility of an impending cyclical bear market ahead. In fact, while I still believe a correction is possible, I'd definitely lower the odds of that happening unless conditions change.
Bottom line, I'd watch for two things. First, technology will need to lose 234 price support (on the XLK) and, second, we'd need to see a bunch of selling in industrials, in particular, and also financials.
This doesn't change my view on my end of year target. I'm sticking with 7000 at year end, but I don't view this research as a suggestion that U.S. stocks will explode higher. I simply believe the selling that results from further rotation away from growth is likely to be contained by the improving industrial and financial sectors and we'll see lots of "chop" ahead.
Transportation stocks have exploded higher in 2026 and I believe that suggests a strengthening economy in the 2nd half of the year, but which also means we're less likely to see rate cuts in 2026. This latter piece of information is resulting in a repricing of growth stocks.
I believe that will create plenty of continuing opportunities in value areas of the market - at least until we see the technical picture improving for technology and other growth stocks. Given the current value of the Volatility Index ($VIX) above 17, I think it's fair say that there's still plenty of risk for extreme choppiness ahead.
Happy trading!
Tom