
EB Daily Market Report - Wednesday, February 11, 2026
DMR Correction
First, I'd like to retract my statements yesterday regarding the nonfarm payrolls, especially since they weren't released until this morning. ??. I do my best to predict the future when it comes to the stock market, but no I did not have any advanced notice as to the January jobs report. I'm not crazy, but I may or may not have had a senior moment and been slightly delusional.
Jobs were released TODAY and they came in well above expectations, 130,000 vs. 55,000. More on Economic Reports at the bottom of this DMR.
Executive Summary
- Futures were higher overnight and jumped a bit more after the January nonfarm payrolls came in above expectations
- The 10-year treasury yield ($TNX) spiked, however, over 5 basis points and above 4.20% after the payroll report; it's currently at 4.17%
- Large cap growth (IWF, -0.29%) initially moved higher and attempted to continue its recent rally, but has struggled since the opening bell
- Large cap value (IWD, +0.14%) did make a new all-time high this morning and is performing better on a relative basis today
- Cryptocurrencies remain under pressure, with bitcoin ($BTCUSD, -2.74%) back below 67,000
- Crude oil ($WTIC, +1.60%) is up to $65 per barrel, leading energy (XLE, +2.62%) higher
- Energy and materials (XLB, +0.87%) are among today's sector leaders
- Our 3 most aggressive sectors are weak, though technology (XLK, +0.34%) is higher
- Industries within energy, led by oil & equipment & services ($DJUSOI, +3.00%), are performing exceptionally well - more on this below
Market Outlook
Banks ($DJUSBK) typically are not viewed as "leaders". However, we do like to see banks doing well and at least "going along for the ride" with the S&P 500 when we're rising in a secular bull market. Banks provide liquidity to help grow periods of economic strength and access to capital is a major concern for many companies trying to compete. Here's how banks and regional banks (KRE) look relative to the S&P 500:
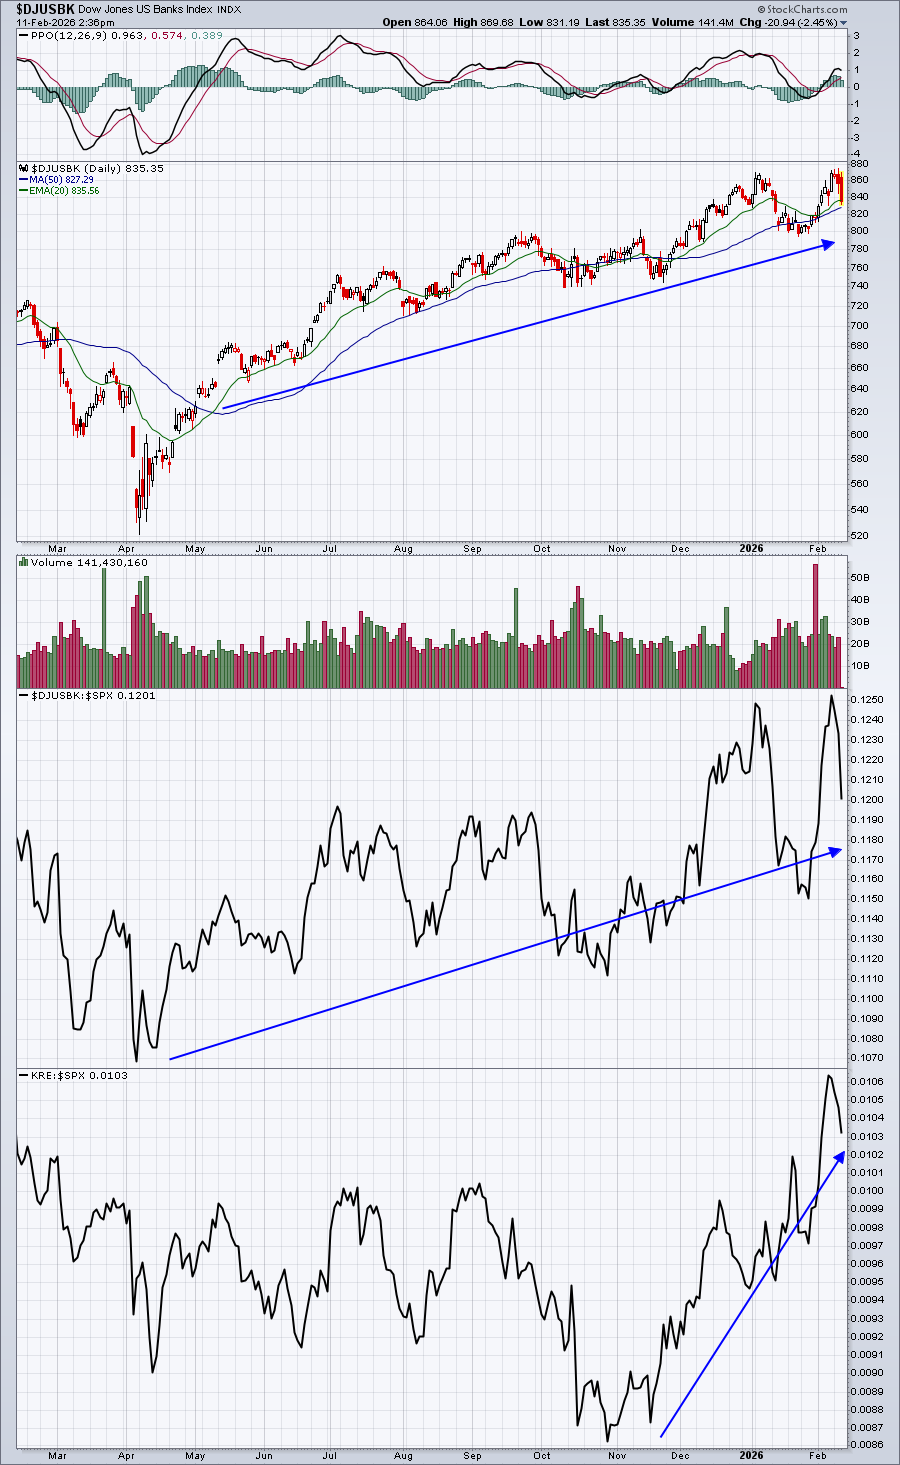
Regional banks are more cyclical in nature than their larger counterparts. The economy, the "spread" (what banks earn from loans/investments vs. what they pay to borrow), and the regulatory environment all play a key role. In my opinion, given the recent economic endorsement (transports rallying in particular), the regional banks have really assumed a leadership role. They're in a very good spot as economic strength and deregulation will play a big role in their increasing profitability. Also, the 10-year treasury yield ($TNX) remains elevated above 4%, while the next short-term move by the Fed will likely be another rate cut, whenever it happens. This is also a favorable environment for banks in general, but regional banks in particular. I believe that's why you see the KRE:$SPX ratio moving up so decisively over the past several weeks, coinciding with strength in other areas that would benefit from a strengthening economy.
Sectors/Industries
Rotation is important to watch as it helps us re-strategize, especially as short-term traders. We don't know how long it might last, but energy currently is the hottest sector. The XLE and XLB have the two highest SCTR (StockCharts Technical Rank) scores among all sector ETFs at 96.3 and 90.6, respectively. Industrials (XLI) are climbing fast and are at 84.2. These are the 3 areas where it's easiest to make money in - if you're a short-term momentum trader.
Below is a chart of all energy industry groups, other than coal ($DWCCOA), highlighting their recent relative strength:
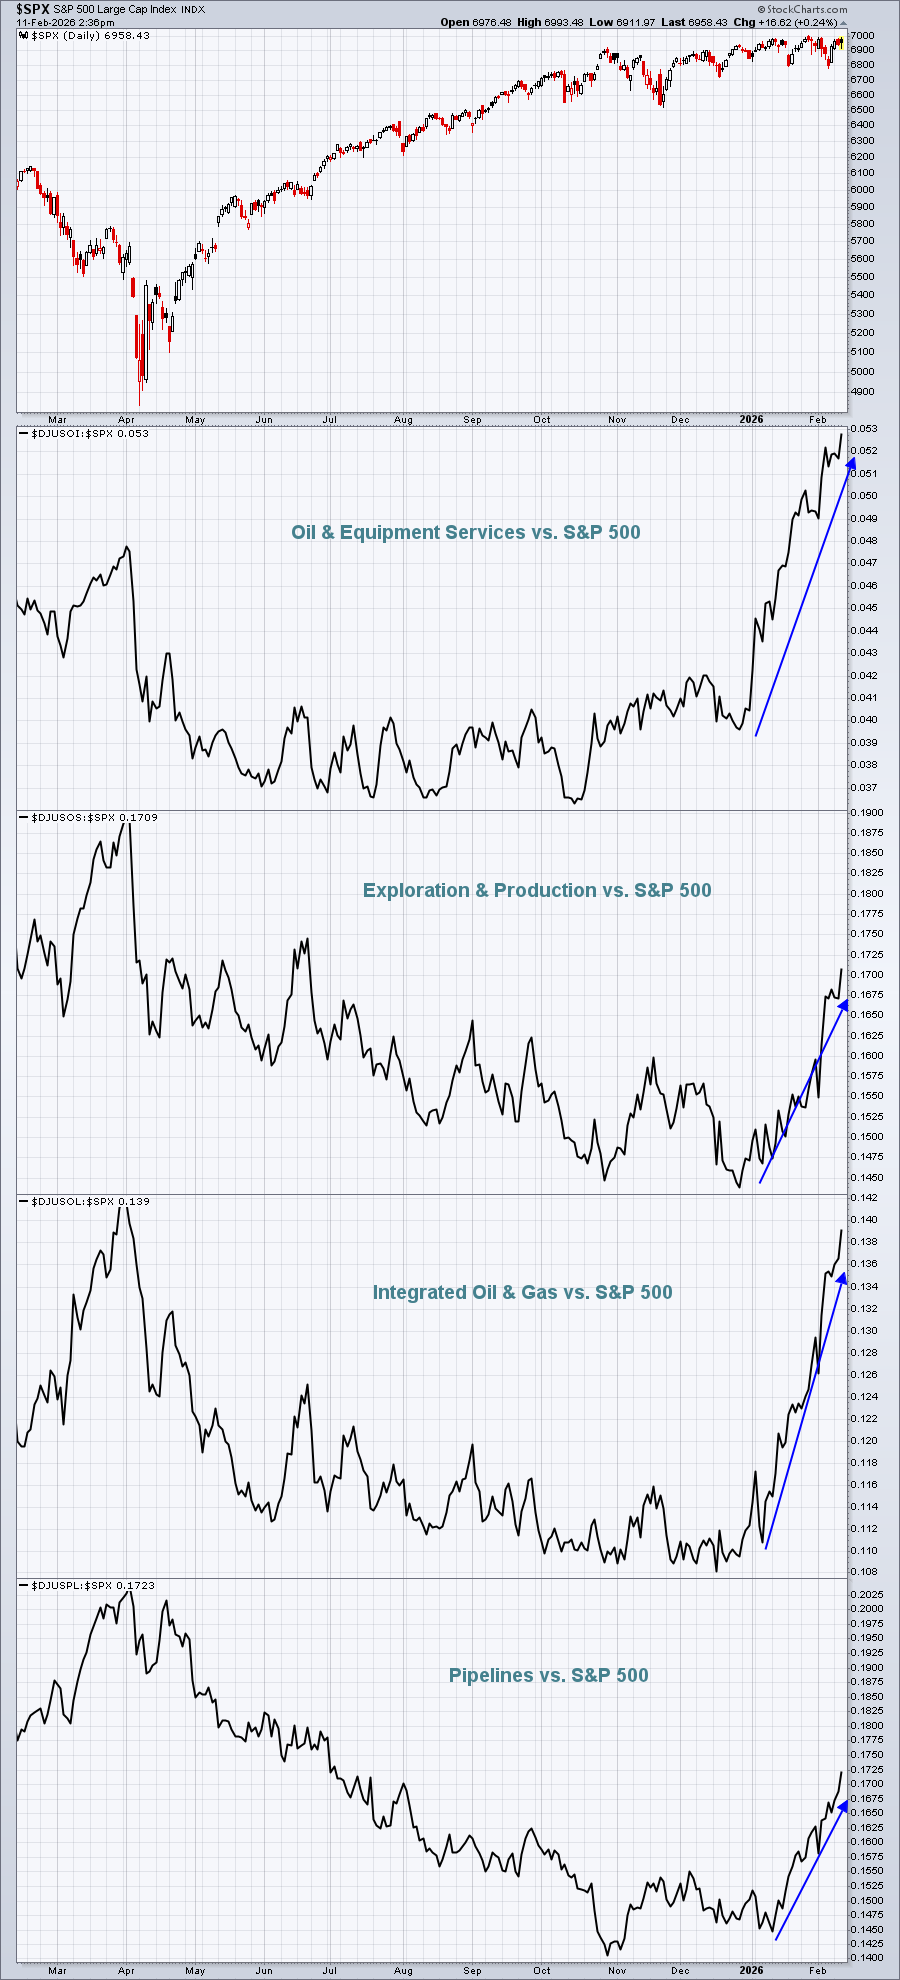
If you're trying to beat the S&P 500, then trading energy stocks right now is a way to do that. In our Model ETF Portfolio that we unveiled in mid January, we included the XLE and weighted it 10%, roughly 4 times its weighting in the S&P 500. That, along with overweighting materials (XLB) and underweighting technology (XLK), has enabled us to strongly outperform the S&P 500 so far this quarter.
ChartLists and Trading Strategies
Currently, we have 11 energy names in our Strong Earnings ChartList (SECL) and 27 in our Strong Future Earnings ChartList (SFECL). The latter is more of a momentum-based ChartList and I can't recall a time recently when the SFECL has had 27 energy names on it. As money rotates into areas like energy, the SFECL will automatically begin selecting more of those stocks via scan. 25 of these 27 energy stocks currently trade above their 20-day EMAs. Pullbacks to test those 20-day EMAs can be excellent entry points.
A smaller and lesser-known energy company, Flowco Holdings (FLOC) in the oil equipment & services area ($DJUSOS) is a perfect example of what to look for, in terms of moving average tests:
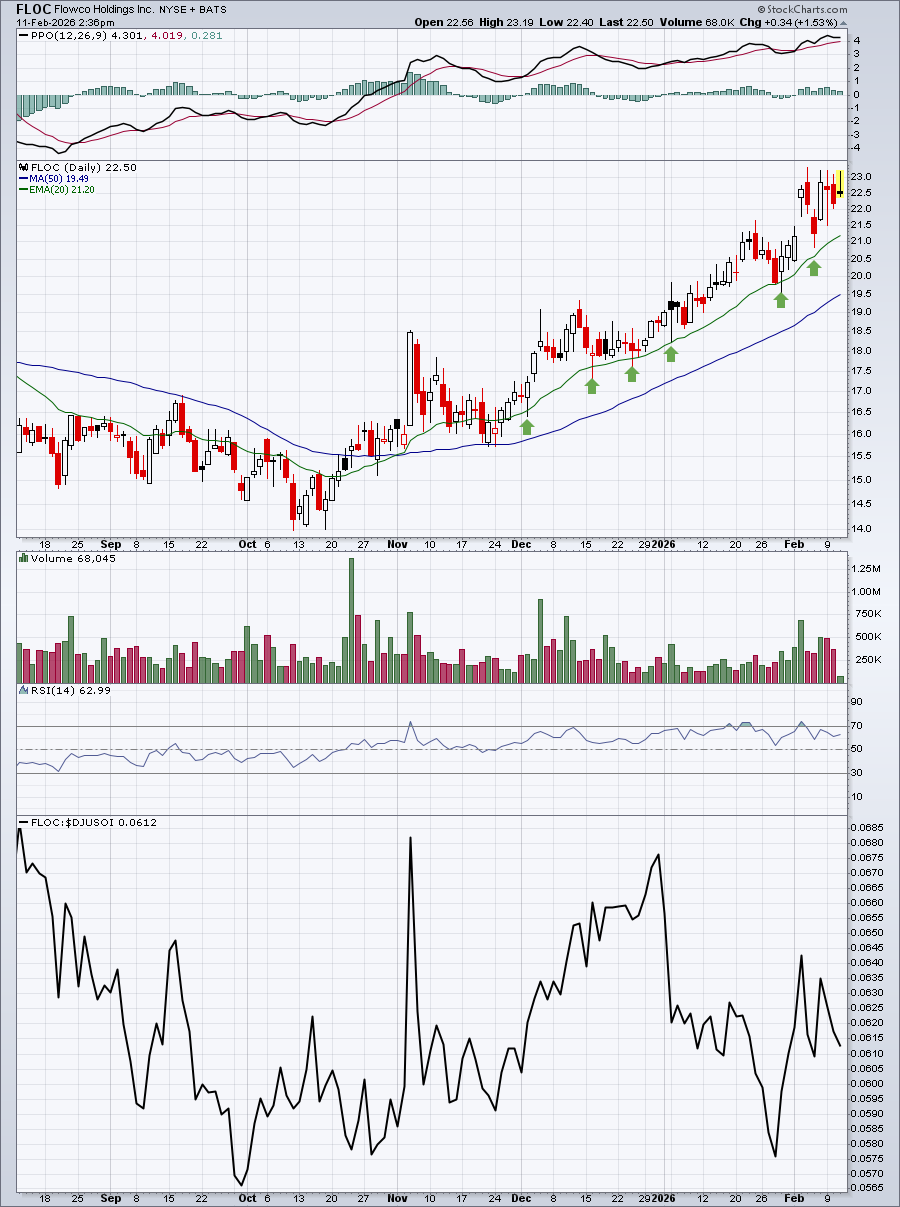
In the bottom panel of FLOC's chart, you can see that its relative strength isn't anything great, so I'd be inclined to look at other stocks in the space. However, the successful 20-day EMA tests still remain (green arrows).
Upcoming Earnings
Our Upcoming Earnings ChartLists and Upcoming Earnings Relative Strength ChartList are included on our website.
Economic Reports
January nonfarm payrolls: 130,000 (actual) vs. 55,000 (estimate)
January unemployment rate: 4.3% (actual) vs. 4.4% (estimate)
January hourly wages: +0.4% (actual) vs. +0.3% (estimate)
December JOLTS: 6,500,000 (actual) vs. 7,100,000 (estimate)
Happy trading!
Tom