
EB Daily Market Report - Thursday, February 19, 2026
Executive Summary
- Futures were lower overnight and our major indices gapped lower
- Max pain on the SPY and QQQ of 685 and 610, respectively, have been tested, so I no longer pay attention to max pain levels as we close out the week
- The small cap IWM has performed best since the early weakness this morning
- Financials (XLF, -1.15%) and technology (XLK, -0.78%) are lagging today, keeping pressure on the S&P 500, which is hovering less than 1% above key 6797 price support
- Energy (XLE, +0.81%) continues strengthening and now has the highest SCTR score (96.3) among all sector ETFs
- Commercial vehicles & trucks ($DJUSHR, +2.77%) is getting a lift from Deere & Co (DE, +12.73%), which is soaring after posting its latest quarterly results
- Crude oil ($WTIC, +2.42%) has risen back to $67 per barrel, providing strength in many energy stocks
- The 10-year treasury yield ($TNX) hasn't really budged despite the lower-than-expected initial jobless claims this morning
- Carvana (CVNA, -10.75%) and Yeti Holdings (YETI, -12.13%) weren't as fortunate as DE, when it came to earnings reactions
Portfolio DRAFT
Our Portfolios that were drafted in November 2025 come to a conclusion at today's close. We made the conscious decision to step away from the market back on December 1st to simply avoid the risk that was becoming more and more apparent. Many signals began flashing that being long wasn't the best idea, at least not in the short-term (weeks to months, NOT years). At the time, the Model Portfolio was up 3.43% for the quarter (in less than 2 weeks), while the Aggressive Portfolio had already jumped 7.53% for the quarter. We were ahead of the S&P 500 at the time, which was at 6812.63 at the close on December 1st, when we exited our stock portfolios and moved to cash. Currently, as of this writing, the S&P 500 is at 6863, less than 1% higher than it was at that December 1st close. While the S&P 500 has gained ground, it badly lagged historical December and January performance, which is normally quite bullish.
Our portfolios have actually performed quite well, given the nervous and volatile action over the past couple months. Had we held our portfolios, they each would have gained the following percentages for this quarter (November 19-February 19), as of Wednesday's close:
Model Portfolio: +15.63%
Aggressive Portfolio: +14.39%
Income Portfolio: +12.63%
Quite honestly, that's remarkable performance considering that each portfolio holds 10 unique stocks. Each has continued to gain nicely, despite a market that's been volatile with plenty of whipsaw action. We will not take credit for the gains since December 1st as we moved to cash for our tracking purposes. We are, however, proud of our latest portfolios and how they've "weathered the storm."
So now it's time to turn the page and look forward to next quarter. Last night, we held our latest Portfolio Draft. We "drafted" 10 stocks into our Model and Income Portfolios, and 12 stocks into our Aggressive Portfolio. Our stocks generally carry a 10% weight each in our Portfolios, but there were 4 stocks in the Aggressive Portfolio that were considered riskier and we assigned them each a 5% weighting. The other 8 were weighted 10%.
Given the recent market rotation and increasing Volatility Index ($VIX), which is currently above 20, we are reserving the right to "re-draft" the portfolios at some future date within the current quarter, if we feel the need to do so. I do feel a bit better regarding market clarity than I did back in early December. It's not that I feel more bullish, because I still believe we're going to see a lot of back and forth action in 2026. But the rotation away from growth has not been nearly as bad for the market, mostly due to the huge gains in industrials, energy, and materials. That's helping to offset the poor recent performance in Mag 7 and software stocks.
Market Outlook
One major long-term change taking place in the U.S. right now is the potential breaking of the 15-year uptrend in the U.S. Dollar Index ($USD). A weak dollar typically tailwinds for international stocks, as well as U.S. companies that do a lot of business around the globe. Foreign revenues and profits are translated into U.S. dollars much more favorably when our dollar is trending lower, which could be the case for a lengthy period ahead.
Here's the technical case for a potential dollar breakdown:
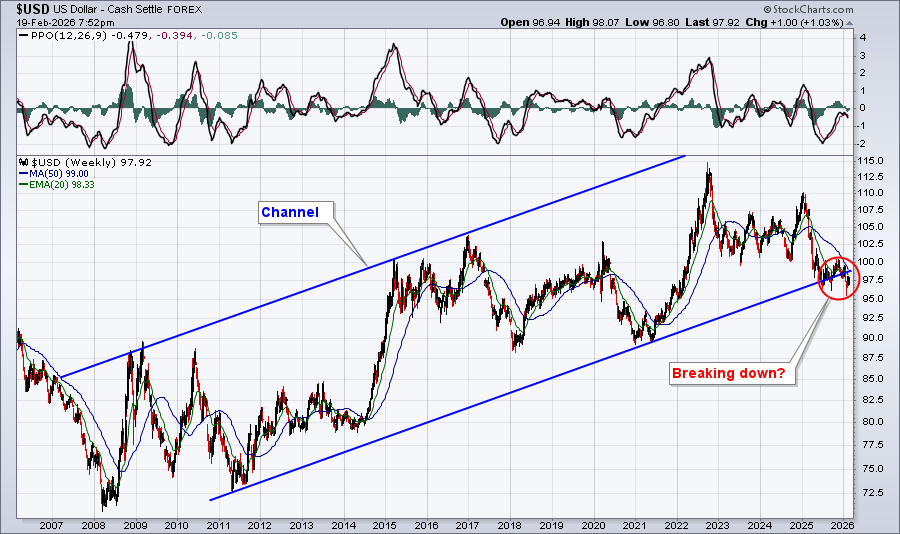
The stock market advances and declines under all different dollar scenarios, so I wouldn't assume that a weakening dollar will somehow negatively impact stock prices.
Sectors/Industries
Technology (XLK) is obviously a very important piece of the market puzzle and right now it's particularly important, because of its relative weakness the past few months. While I keep watching important price support on the XLK in the 134-136 range, I'm also watching a short-term downtrend on the hourly chart. If the XLK is going to avoid a breakdown, it will soon need to break out of this downtrend to the upside:

Of course, the XLK heavily influences the NASDAQ 100 ($NDX). Below is an hourly chart of the QQQ, an ETF that tracks the NDX:
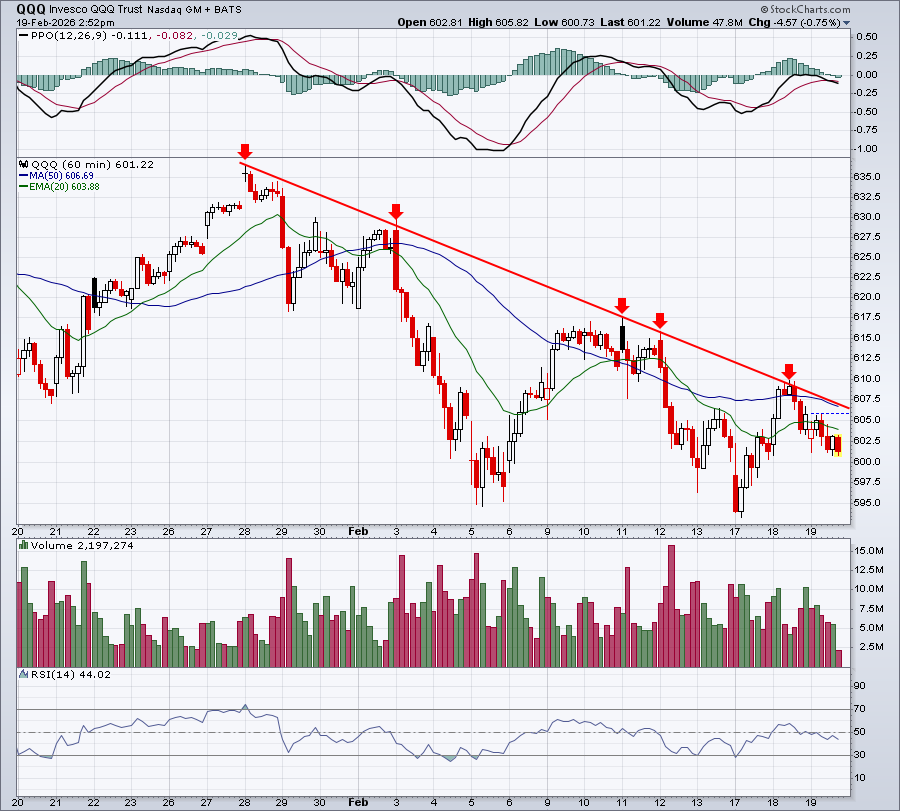
This same downtrend is quite apparent on the QQQ chart, with 4 tests of this downtrend line since the top on January 28th. Just like the XLK, the QQQ needs to see some buying.....and soon. The more successful tests that a trend line has, the more important the trend break - when and if it occurs.
From a short-term trading perspective, it's important to keep a close eye on both of these downtrends.
ChartLists and Trading Strategies
Given that February monthly options expire tomorrow and we're perilously close to key support, as illustrated above, I think it's prudent to remain somewhat cautious as we close out one of the more bearish weeks of the year.
As I've stated on many occasions, I rarely short individual stocks during a secular bull market. The only exception would be if I was anticipating a cyclical bear market and we began to see price breakdowns to confirm that belief. I really don't want to challenge a secular bull market, which I firmly believe that we remain in. In time, I expect new all-time highs. If the current choppy action continues throughout much of 2026, I'll simply bide my time and wait for better opportunities. Saving capital and potentially increasing buying power isn't a bad strategy when signals suggest that we do so.
Upcoming Earnings
Our Upcoming Earnings ChartLists and Upcoming Earnings Relative Strength ChartList are included on our website.
Economic Reports
Initial jobless claims: 206,000 (actual) vs. 223,000 (estimate)
February Philadelphia manufacturing survey: 16.3 (actual) vs. 10.0 (estimate)
January pending home sales: -0.8% (actual) vs. +1.8% (estimate)
December leading economic index: -0.2% (actual) vs. -0.2% (estimate)
Happy trading!
Tom