
EB Daily Market Report - Brief Update - Thursday, February 26, 2026
Today's action is bifurcated, meaning that some areas are strong, while others are weak. The high-growth NASDAQ is clearly the weakest, down roughly 1.25% as Wall Street reacts negatively to NVIDIA Corp's (NVDA, -5.44%) quarterly earnings report, despite NVDA beating estimates on both revenues and earnings per share. Semiconductors ($DJUSSC, -4.64%), as a group, are having perhaps their worst days of 2026 and it's definitely taking a toll on the NASDAQ.
Meanwhile, value-oriented areas like financials (XLF, +1.29%) and industrials (XLI, +0.73%) are enjoying gains and leading to gains in both the Dow Jones and small cap Russell 2000 (IWM).
Yesterday's action is yesterday's action. Growth performed well on Wednesday and had begun to put together a string of reasonably strong days over the past week. The iShares Russell 1000 Growth ETF (IWF) bottomed on February 17th after appearing to break down, then closed back above its 20-day EMA for the first time in a month on Wednesday:
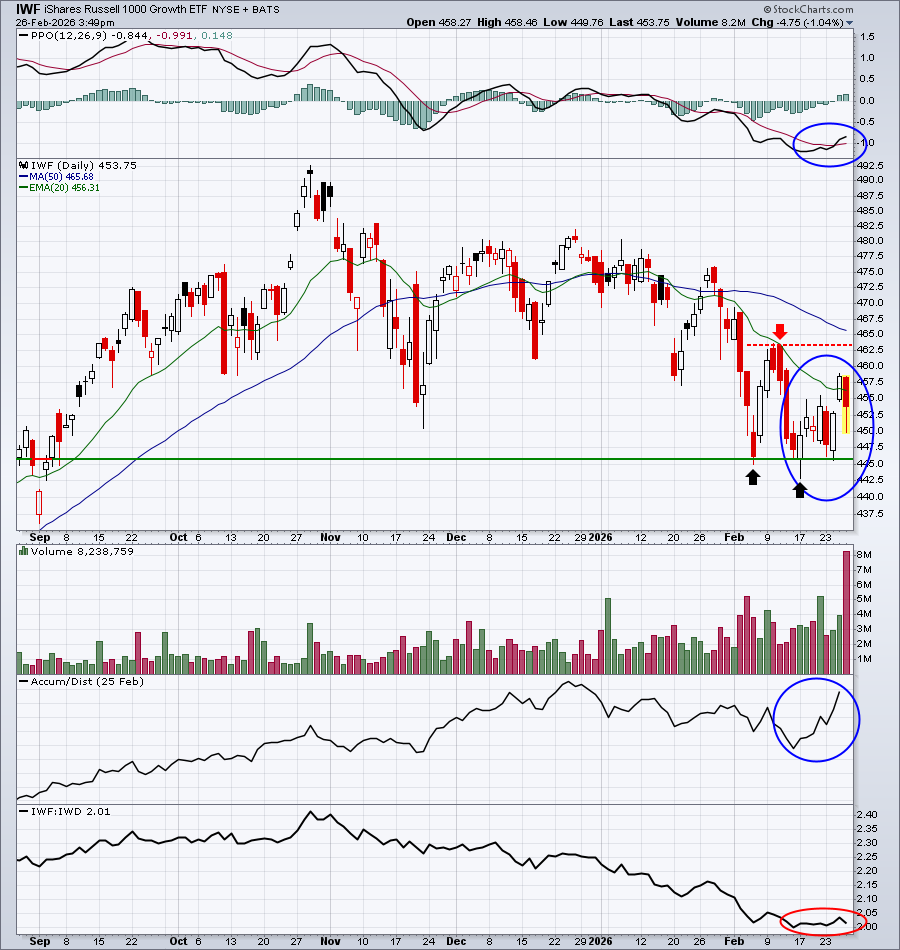
I see a downtrending chart, but with a few notable improvements. First, and most importantly, the price closed back above its 20-day EMA for the first time in a month. That won't mean much, however, if we finish weak today and close right back beneath it again. It would be more bullish, though, if we finish strong after having intraday weakness that carried the IWF well below the 20-day EMA earlier today. Second, the daily PPO jumped back above its "trigger line" (9-day SMA of itself). Finally, the AD line has soared since that February 17th bottom, which is an indication of strong daily finishes and potential accumulation.
Now for the other side of the story. The two black arrows mark a double bottom. This CAN be a bottom on a chart, but to confirm and execute the pattern, we need to see the IWF clear the high (red arrow) in between the double bottom lows. That has yet to happen. Next, while the absolute price action in the IWF has been solid recently, it's made almost no headway vs. its large cap value counterpart, IWD. The bottom panel shows that the IWF:IWD ratio remains near its multi-month low.
The IWF is home to many of the areas holding the stock market back over the past 3-4 months. The Mag 7 (NVDA, AAPL, MSFT, GOOGL, AMZN, META, TSLA) account for roughly 52% of the entire ETF. The two largest industry groups are semiconductors (20.66%) and software (15.45%). Over half of the semiconductor representation is NVDA, which has been a significant laggard in the space and is down today after reporting its latest quarterly results after the bell on Wednesday. If there is one ETF to truly keep an eye on every day, it's the IWF. Until this ETF shows much more strength, the S&P 500 is likely to find it very difficult to clear 7000 price resistance.
We'll keep watching the action, but for now, the whipsaw action continues and S&P 500 price action remains within that same 6797-7000 price range. Also, the Volatility Index ($VIX, +4.52%) is back on the rise. It also remains in a key range from 17-20. I continue to believe that selling would accelerate IF the S&P 500 loses support at 6797, while simultaneously seeing the VIX drive back to the 22-23 level or higher.
Happy trading!
Tom