
EB Daily Market Report - Tuesday, March 2, 2026
Executive Summary
- Futures were sharply lower overnight and our major indices gapped lower
- Crude oil prices ($WTIC, +7.30%) continue to surge, but have retreated from earlier highs
- All 11 sectors are lower, but communication services (XLC, -0.53%) and energy (XLE, -0.70%) are showing relative strength
- Materials (XLB, -3.06%) and industrials (XLI, -2.07%), two recent leaders, are lagging badly today
- Gold ($GOLD, -3.29%), typically a hedge during uncertain markets, is leading most commodities lower
- The 10-year treasury yield ($TNX) jumped earlier to 4.12%, but has retreated back to 4.06% - still higher by a basis point on the session
- Target (TGT, +5.34%) is leading the S&P 500 after reporting quarterly results
- Albemarle (ALB, -8.19%) drops for a 4th straight session to lead S&P 500 stocks to the downside; it did bounce off support in the upper 150s
- Two big jobs reports are coming up later this week - ADP employment on Wednesday and Nonfarm Payrolls on Friday
Market Outlook
We have a couple of jobs reports coming out later this week. First, we'll get the February ADP employment report on Wednesday morning pre-market and estimates are pegged at 48,000 jobs, up slightly from January's 22,000. On Friday, the February nonfarm payrolls will be released and the January hotter-than-expected 130,000 number is expected to drop back to 50,000. The unemployment rate is expected to improve from 4.4% to 4.3%, while hourly wages is seen to fall back to 0.3% from 0.4%. The market is in a quandary. Another stronger-than-expected number likely pushes back the potential of further rate cuts, while also raising suspicion of higher inflation down the road.
A weak number, however, could spur recessionary fears. It's like we're in a no-win situation right now. I suppose the best number will be one that's slightly positive, but not too hot. Ever feel like the stock market is walking a tightrope or high wire? That's what it feels like to me right now. Any misstep could cause a big drop.
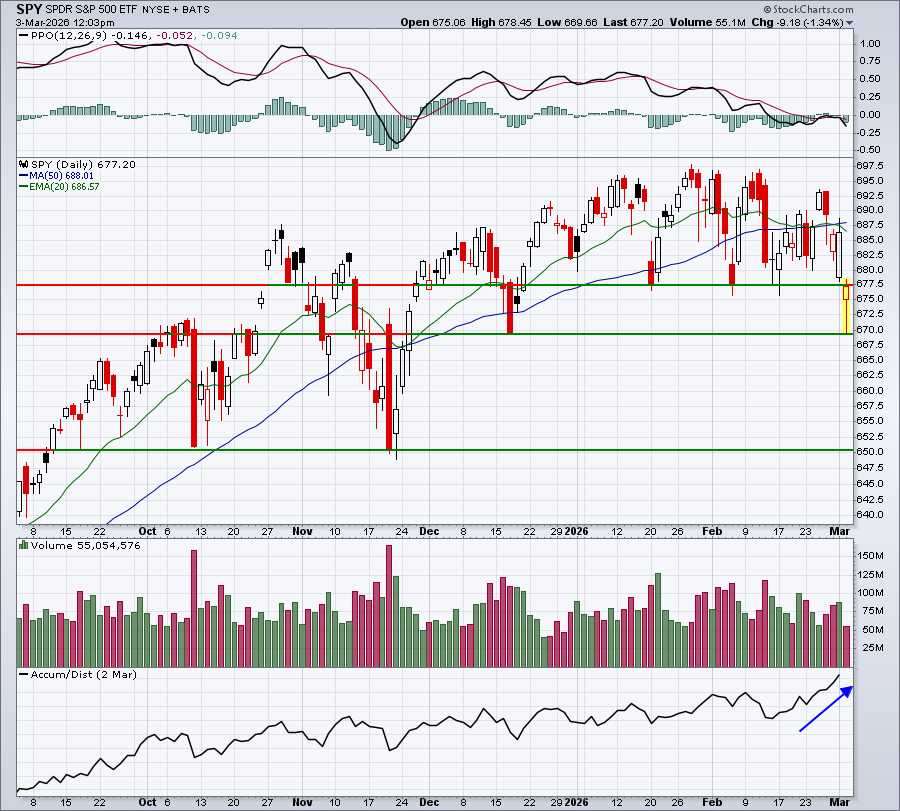
We were once again in short-term breakdown mode this morning and the selloff was intensifying, but the bulls have stepped back in and a significant recovery is underway. I have no idea how this is going to finish today. But here are the key areas of support/resistance on the SPY and QQQ:
SPY
QQQ
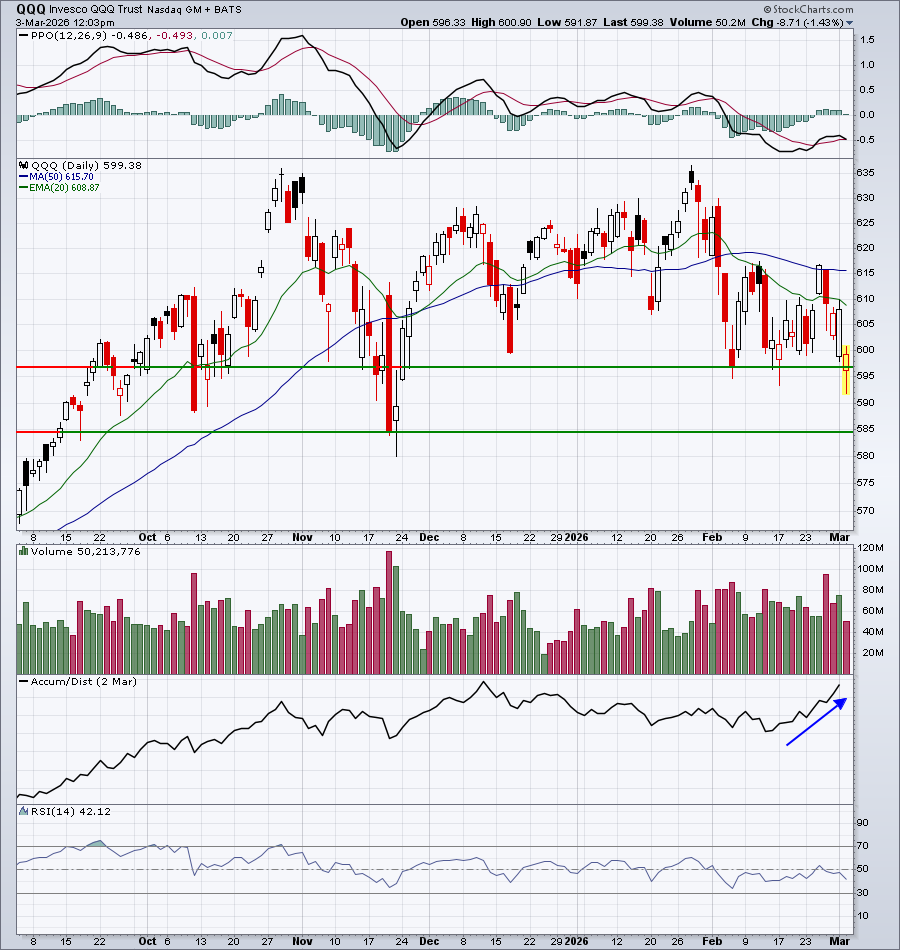
Both ETFs gapped below recent price support and have recovered to battle overhead price resistance. I'm much more interested in closing levels than I am in intraday levels, so let's see where we close today. A weak finish would likely lead to more short-term selling, while the opposite is true on a strong finish.
I do like the recent strength in the AD line. It appears that we are seeing some buying and support from Wall Street, which could be instrumental in a short-term reversal.
Sectors/Industries
The large cap growth (IWF) vs. large cap value (IWD) battle rages on. The IWF:IWD ratio is one of several "sustainability ratios" that I like to follow to get a better grasp of the underlying strength or weakness in the market. This IWF:IWD ratio has been downtrending since Q4 2025 and still is showing no signs of a major reversal:
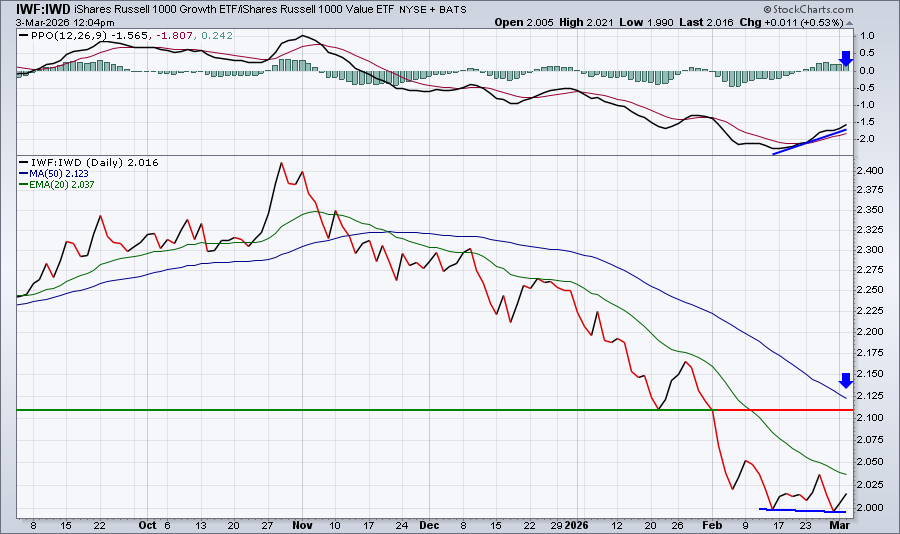
The positive divergence suggests that the momentum of the IWF:IWD downtrend could be slowing. If so, a move back up to test the declining 50-day SMA could be in store. Also, after positive divergences print, it's fairly common to see PPOs return to their centerlines for a "reset". I wouldn't be shocked to see this occur at some point during March and ahead of next earnings season. The Mag 7, which were underperforming the past few months, are showing a bit more resiliency of late, which could trigger this short-term reversal in fate for large cap growth.
ChartLists and Trading Strategies
Today is definitely a day to simply sit back and watch. Sure, you can take a guess on whether we're going to collapse or rebound and make a lot of money if you call it right. Just understand that high volatility also means high risk and losses can mount just as quickly as profits. I don't like to "roll the dice" with my portfolio like I'm sitting at a craps table in Vegas. I want to see a much more stable market environment.
Nothing good happens when the Volatility Index ($VIX) is in the 20s and rising. That's where we are now. It is true that the best time to jump in the. markets is when the VIX tops, but how can you predict when that will be? If you get it wrong by a day or two, or longer, then there'll be a significant price to pay.
I'll wait.
Upcoming Earnings
Our Upcoming Earnings ChartLists and Upcoming Earnings Relative Strength ChartList are included on our website.
Economic Reports
None
Happy trading!
Tom