
EB Daily Market Report - Wednesday, March 4, 2026
Executive Summary
- Futures were down last night, but reversed overnight and we saw our major indices gap up
- The February ADP employment report showed jobs above expectations, but not by a lot
- Cryptocurrencies have staged a solid rally, with bitcoin ($BTCUSD, +7.53%) surging to 74,000 earlier - more on this below
- Commodities have settled down a bit, with crude oil ($WTIC, +0.55%) slightly below $75 per barrel
- The 10-year treasury yield ($TNX) has edged up to 4.09%, up 3 basis points, on the slightly-stronger-than-expected jobs number; nonfarm payrolls will be out on Friday
- Strength today has been centered primarily in growth stocks as consumer discretionary (XLY, +1.82%) and technology (XLK, +1.81%) are leaders
- Energy (XLE, -0.68%) is the weakest sector, with consumer staples (XLP, -0.35%) the only other sector underwater
- Telecommunications equipment ($DJUSCT, +2.94%) is showing relative strength and helping to lead the XLK higher
- In discretionary, automobiles ($DJUSAU, +3.42%) are gaining solid ground, led in part by Tesla (TSLA, +3.78%), which is bouncing off key support
Market Outlook
There's been a very interesting development this week. Nearly all the weakness has occurred at the opening bell or during the first 30 minutes of action, mostly reacting to negative media headlines. From that point forward, buyers have dominated. Let me give you an example of how the QQQ has traded thus far this week:
Opening gaps: -17.69
9:30-10:00: +5.67
10:00-11:00: +5.54
11:00-2:00: +11.25
2:00-4:00: +0.23 (does not include anything past 2pm today)
Total change in QQQ from Friday's close: +5.00
Folks, when I talk about market manipulation, this is what I'm referring to. At the opening bell this week, the SKY HAS BEEN FALLING. Then the market opens, individual traders panic out of positions, and Wall Street accumulates. This is the poster child of what many prior market bottoms have looked like. Now this is just a few days and I'm certainly not going on record, calling this a bottom. However, make no mistake about it, I believe this type of behavior is VERY encouraging for the bulls down the road. This reinforces my belief that the downside in 2026 will be limited. It'll be challenging, but very unlikely that it morphs into a cyclical bear market. And further out? We'll be back at all-time highs.
Just my opinion, of course.
Sectors/Industries
Cryptocurrencies are bouncing strongly today. This is an asset class that's been under the microscope for awhile as it started selling off in earnest back in October, when money first began moving away from riskier assets. The really big breakdown occurred when bitcoin ($BTCUSD) lost its 74,000-75,000 support level. That was right before bitcoin continued falling before finding buyers at 60,000. Now we're in a 60,000-75,000 trading range and bitcoin hit just moments ago:
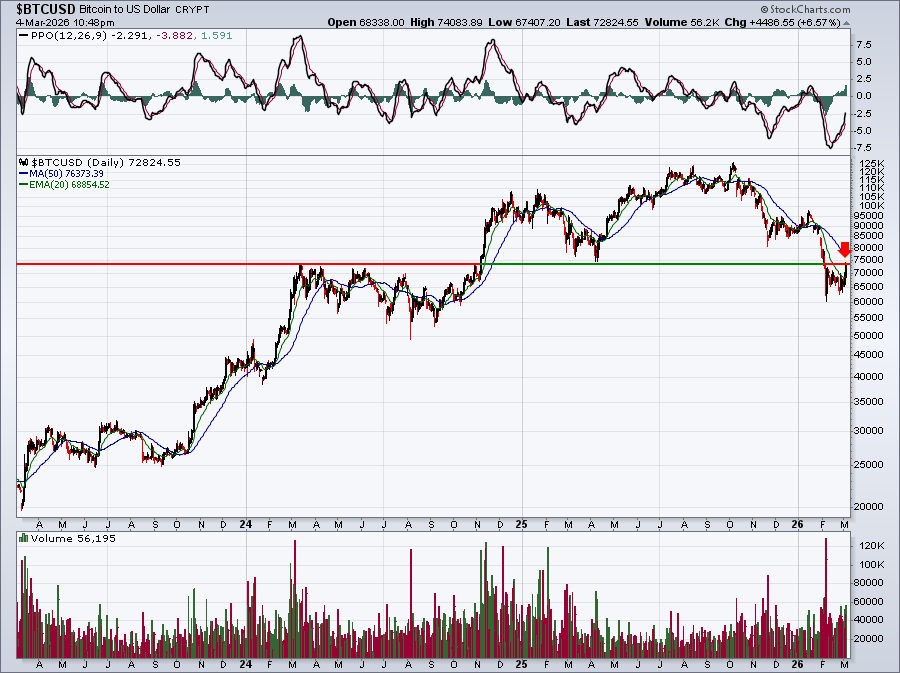
This is a major test of resistance. Do we clear? I'd even go a bit further and give the bears up to the 50-day SMA, currently just beneath 76,400 to defend their turf. My guess is that the sellers win this initial battle, but let's see it play out and go from there.
ChartLists and Trading Strategies
Many growth stocks, especially those in software ($DJUSSW, +1.99%), have rebounded strongly this week. While the media has harped on the big gap downs, it certainly appears to me that the big Wall Street firms are using this nervousness to accumulate one critical area of the market - software. Do I think is THE low in software? Probably not. But I don't believe the group is going much lower and Wall Street has begun accumulating, in my opinion.
Bottoming is a process. We're beginning to see positive divergences form on new lows in the group, which is indicative of waning downside momentum. Another retest of recent lows or even a slight breach could set the group up for a very strong balance of the year.
We have over 20 software stocks on our Strong Earnings ChartList (SECL), so that wouldn't be a bad place to start to look at some of the stocks in this space. Here are two stocks that look interesting:
GCT
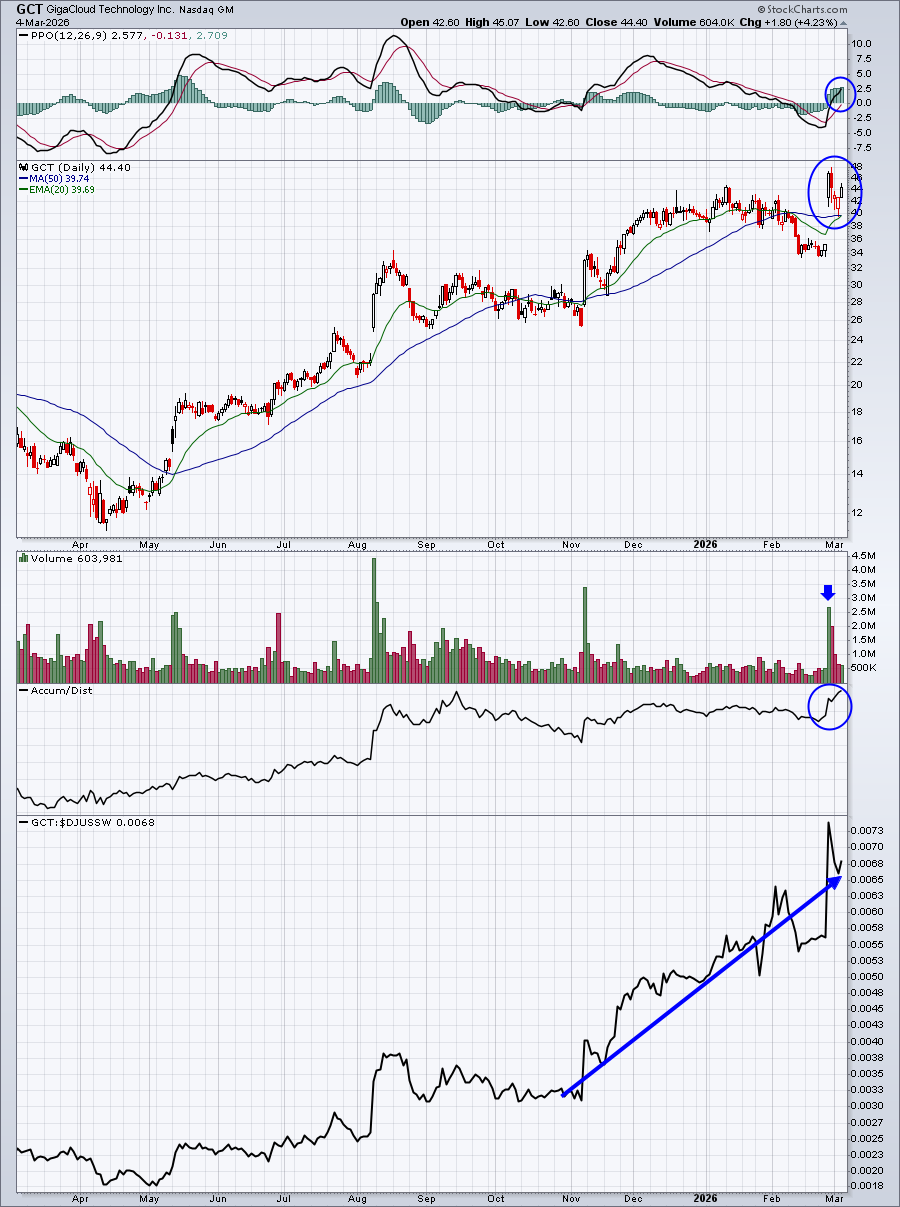
This one has been quite strong, in the face of poor performance amongst its peers. I like the recent breakout, subsequent test of the rising 20-day EMA, and bounce the past two days.
GEN
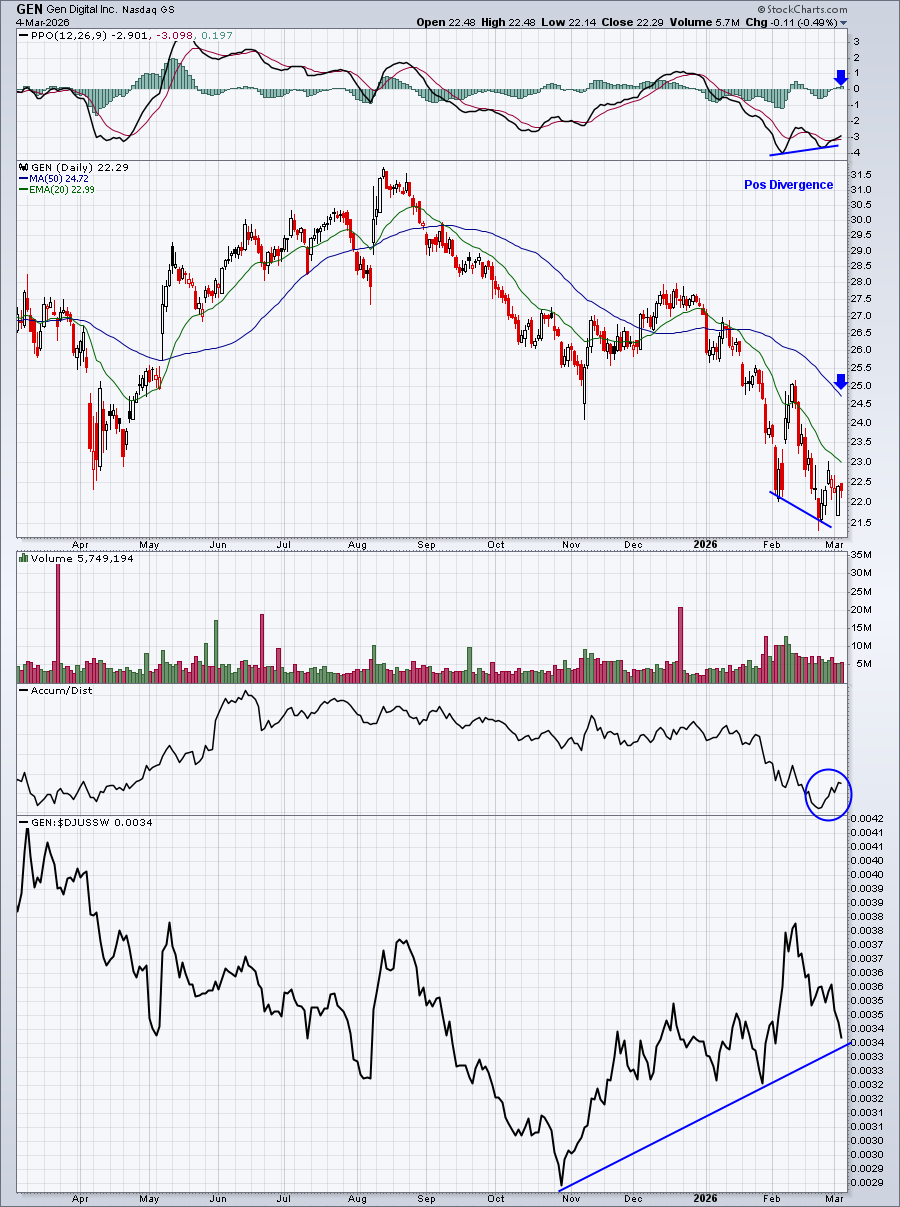
The positive divergence is obviously one takeaway here, but if you look at a long-term monthly chart (not shown above), you'll see a stock that's been trending higher for many years. That suggests this period of rather intense selling could be a great opportunity for those with a longer-term mindset. The positive divergence gives reason to pull the trigger here.
Upcoming Earnings
Our Upcoming Earnings ChartLists and Upcoming Earnings Relative Strength ChartList are included on our website.
Economic Reports
February ADP employment: 63,000 (actual) vs. 48,000 (estimate)
Fed beige book released at 2:00pm ET
Happy trading!
Tom