
EB Daily Market Report - Tuesday, March 10, 2026
Executive Summary
- Futures were higher overnight and our major indices gapped up at the open
- Cryptocurrencies are again on the move, with bitcoin ($BTCUSD, +3.07%) moving back above 71000; 74000-75000 remains key resistance
- Commodities, other than crude oil ($WTIC, -10.71%), are soaring today with gold ($GOLD, +2.60%) jumping back above $5200 per ounce
- Silver ($SILVER, +6.00%) is nearing 90
- Crude oil has significantly pulled back from its recent $120 per barrel high, now residing at $85 per barrel; there could still be more volatility ahead here, especially if there are significant turns in the war with Iran
- AD lines are soaring across many of our indices and sectors, indicative of Wall Street accumulation - more on this below
- Growth (IWF, +0.34%) and value (IWF, +0.41%) are roughly even today, after recent relative strength in growth
- Technology (XLK, +0.78%) and consumer discretionary (XLY, +0.50%) are leading 9 of 11 sectors higher
- Software ($DJUSSW, -1.00%) is notably lagging again today, but thus far holding onto 20-day EMA support
Market Outlook
Last week, I provided an analysis of recent QQQ trading, broken down by period of the day. Primarily, it showed that most of the weakness was at the opening bell and there was mostly buying throughout the trading session. That reeks of market maker manipulation and Wall Street accumulation to me. As I discussed on this morning's Trading Places Live show, this is a signal that it's time to begin accumulating, just like Wall Street is doing. It doesn't mean that we've reached a bottom, although it is entirely possible that yesterday morning's crude oil shock and resulting panic did mark a bottom. Only time will tell on that front.
I have been of the opinion (since December) that we were in for a rough, choppy period ahead and it's certainly been that. I did not believe then, and still do not believe now, that we're going to see a cyclical bear market, which would be a 20%+ drop on the S&P 500. I have felt that it would be a pullback somewhere between the 5%-7% range (to test the double bottom in the 6540-6550 range) and a possible 10%-13% correction (to possibly retest the June breakout above 6144). I believe weakness leading to these levels should be used to accumulate and build a portfolio. I used yesterday's selloff and recovery to take my first step in accumulating.
Here's another look at the QQQ and a summary of how it's traded since the February 12th close (blue circle):
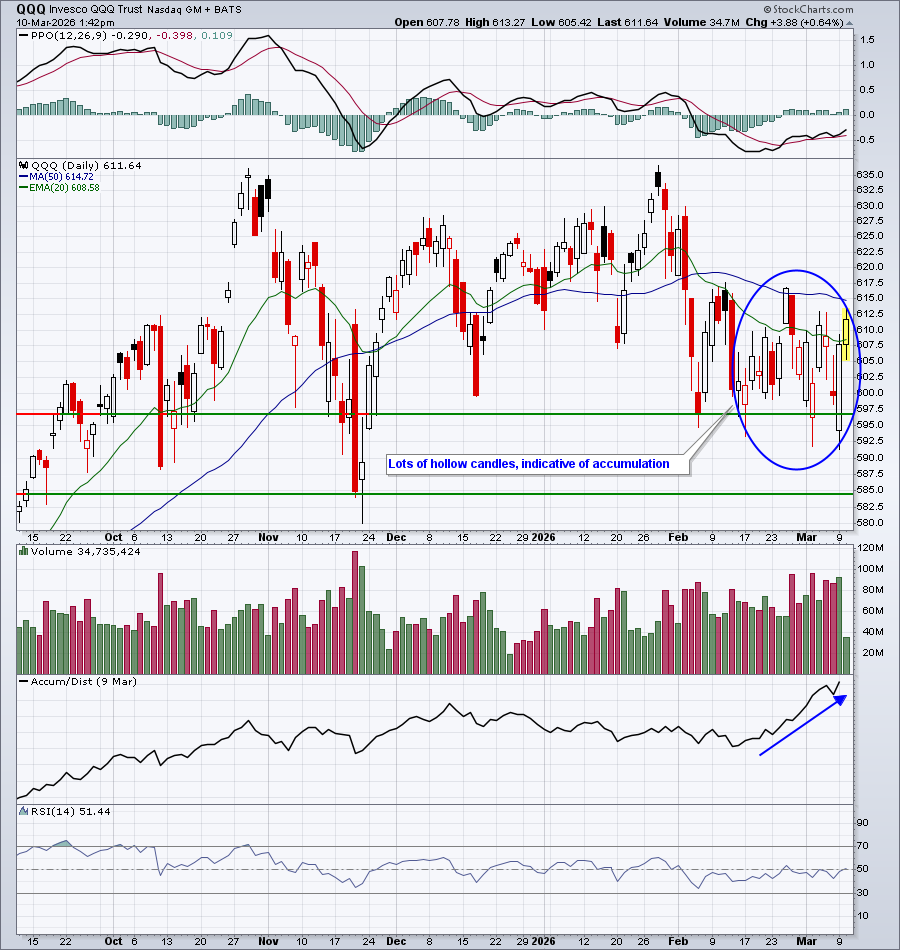
It is very rare when I see an AD line soar during a period of stable or declining prices, but that's exactly what's happening now. And it's happening across just about every major index and every major sector.
I want to be clear about one thing. I am NOT calling a bottom. There are several ways the market could go in 2026 and a number of issues remain unresolved. I believe the recent accumulation is further evidence that supports my belief, however, that any selling will be brief (unlikely to last past this summer, if it even makes it that far) and that we should be expecting more all-time highs down the road. If you are looking to enter stocks at a few different levels on market pullbacks, recent selling on panic is perhaps the first opportunity to do so.
I still believe we could see both the 6540-6550 area as our first key test of support below yesterday's low and 6144 as our more significant test of support. Remember, anything below 6300 would put us in "correction" territory, which is a 10% drop from an all-time high. Our last all-time high was roughly 7000 on the S&P 500.
Sectors/Industries
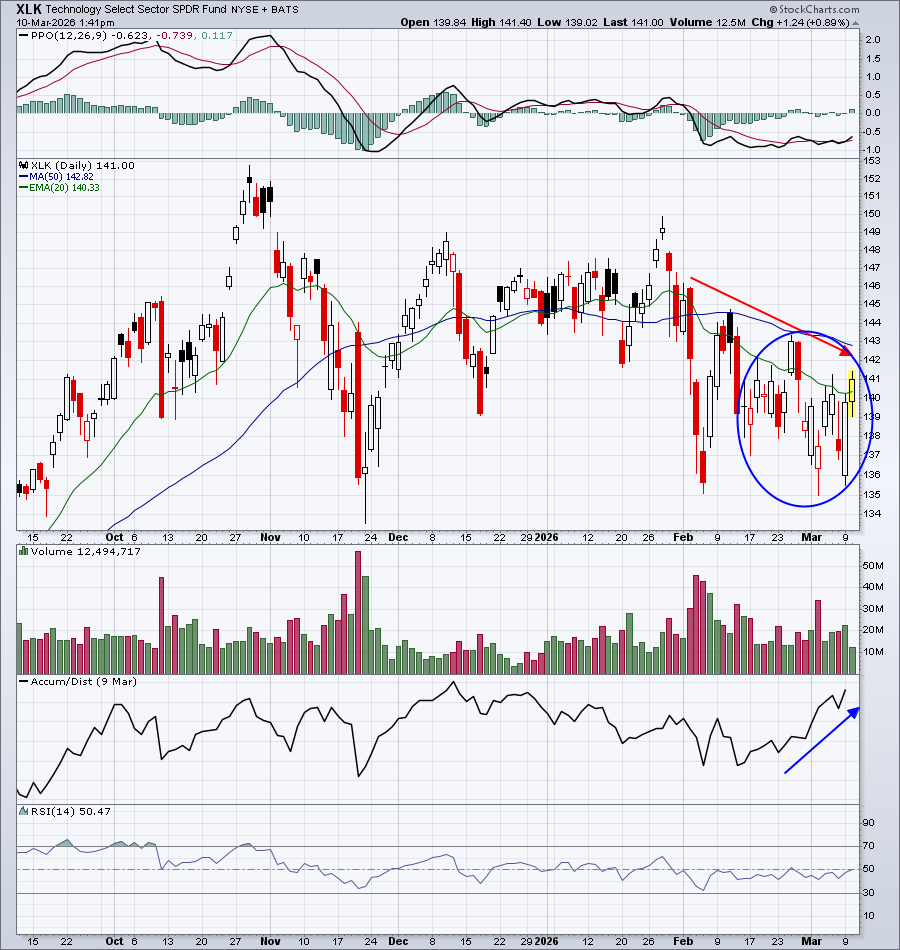
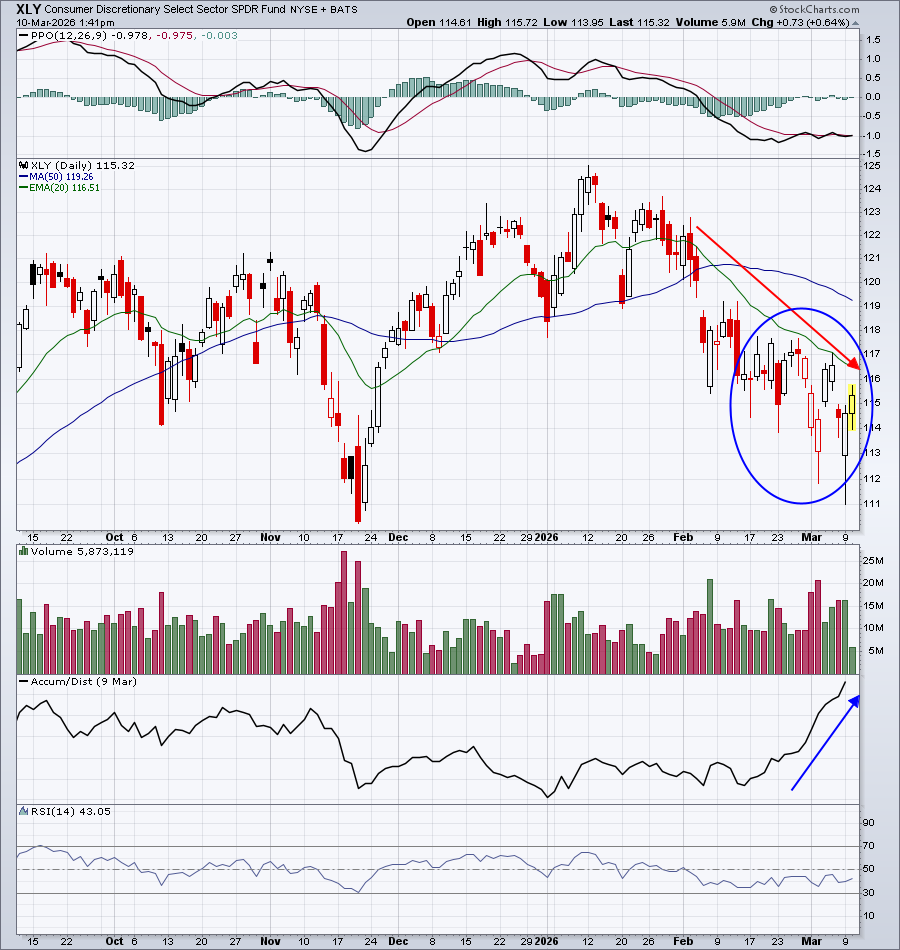
To pick up where I left off above, nearly every sector appears to be seeing significant accumulation after morning weakness. It's reflected in the soaring AD lines. Here are charts of our 3 aggressive sectors - technology (XLK), consumer discretionary (XLY), and communication services (XLC). Pay particular attention to the AD lines, especially with respect to the XLY:
Technology (XLK):
Consumer Discretionary (XLY):
Communication Services (XLC):
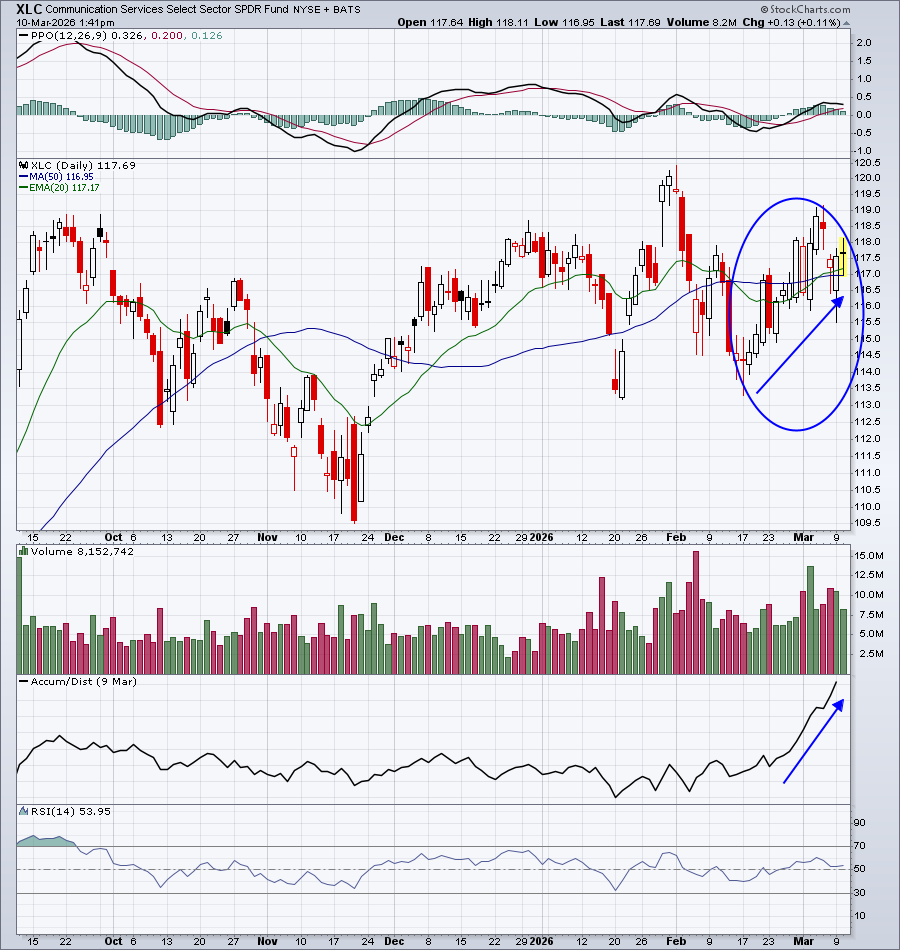
The XLK has been mostly flat. The XLY has been downtrending. The XLC has been uptrending. The one common denominator is that all 3 show excellent AD lines, all moving up without a hitch.
ChartLists and Trading Strategies
We're not just seeing strong accumulation signals in the major indices and sectors. We're also seeing a TON of strong AD lines among individual stocks. As all of you should know, we update our Key Manipulation Excel Spreadsheet every week, so I started by looking at how all of these stocks have traded since the February 12th close. Some of them look downright criminal as market makers have opening many of them lower day after day, only to then buy them all day long. Let's start with Meta Platforms (META), which I bought yesterday (full disclosure):
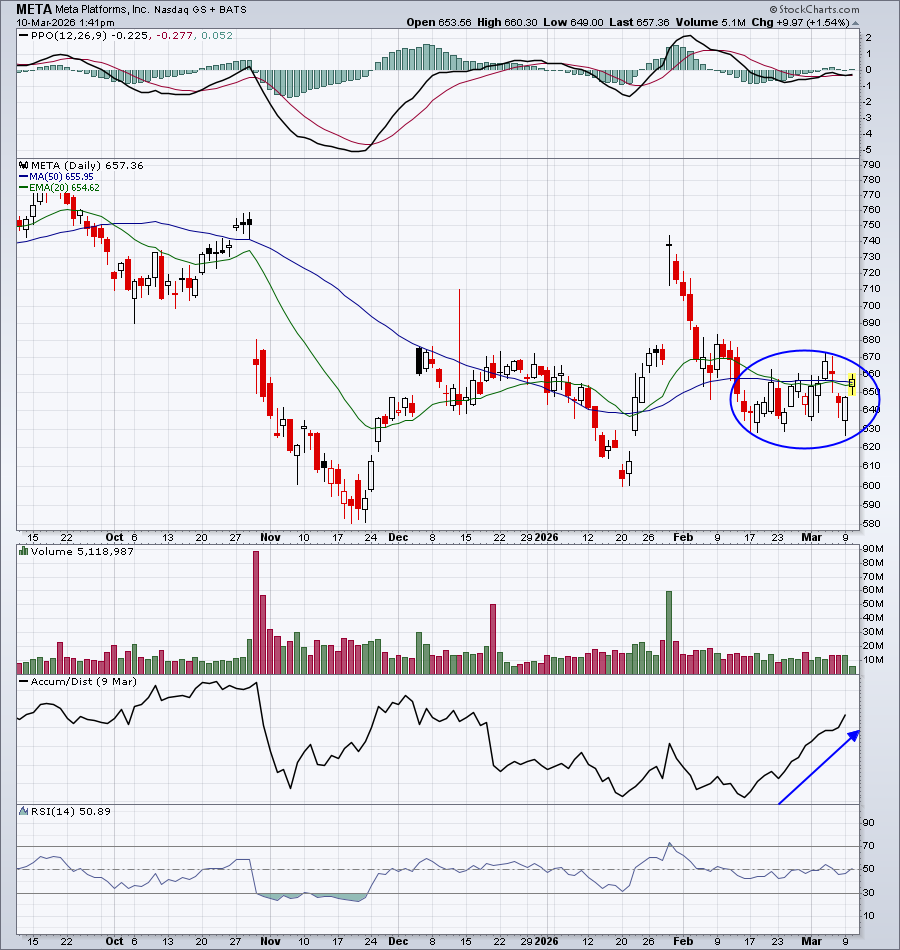
Let me break down META's intraday trading since February 12th for you:
Opening gaps: -71.83
9:30-10:00: +35.59
10:00-11:00: +27.52
11:00-2:00: +2.42
2:00-4:00: +1.44
Think about this. META has gapped lower 13 of the 15 days since February 12th and its total NET gap down (includes the two gap ups) is nearly 72 bucks!!! Yet the stock closed at 649.72 on February 12th and closed at 647.39 yesterday. It's down two bucks. That's it! But how many folks have sold as a result of the scary headlines, the rising VIX, and the big gap downs in the morning? Probably a lot. And what has Wall Street been doing? Happily buying.
Other stocks on our Key Manipulation Excel Spreadsheet that show serious manipulation, in my opinion, include AMZN, AVGO, CRM, and APP.
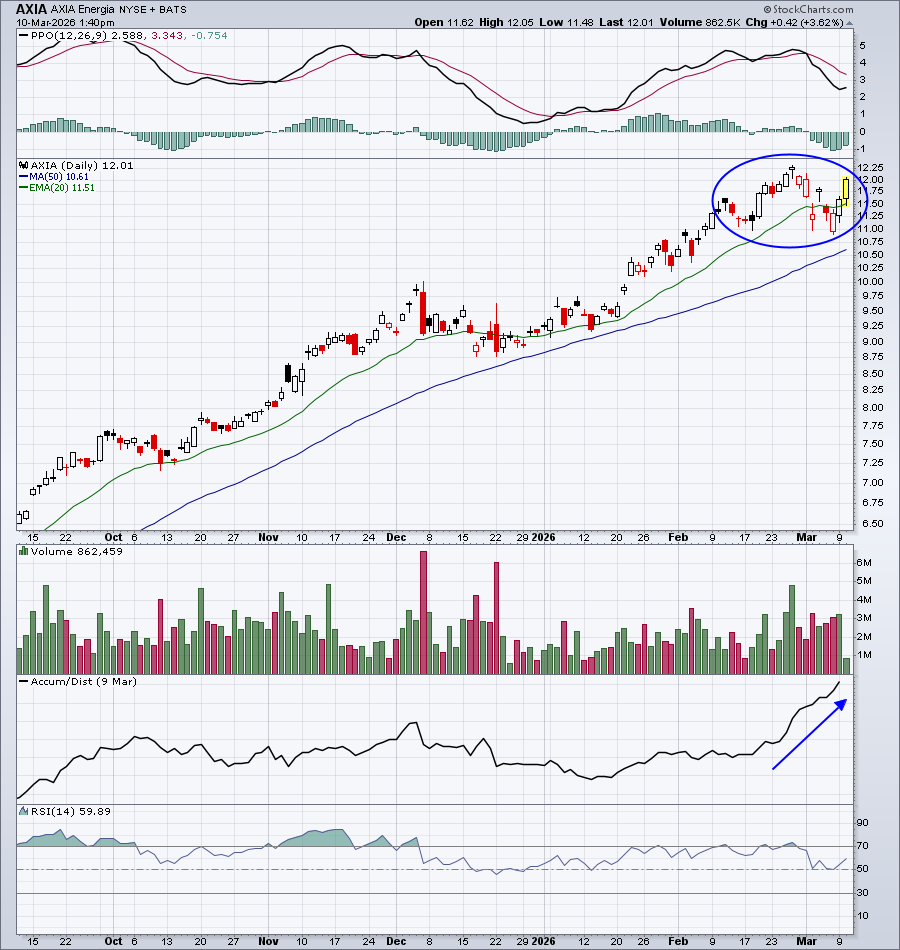
One stock on the Strong AD ChartList (SADCL) that looked interesting, simply by looking at the chart, was AXIA Energia (AXIA), which is in the conventional electricity ($DJUSVE) area. AXIA has dropped .04 since February 12th, despite having net gap downs totaling 1.81 since that day. This is a stock that recently broke to an all-time high and looks solid in this pullback:
Upcoming Earnings
Our Upcoming Earnings ChartLists and Upcoming Earnings Relative Strength ChartList are included on our website.
Economic Reports
February existing home sales: 4,090,000 (actual) vs. 3,860,000 (estimate)
Happy trading!
Tom