
EB Daily Market Report - Brief Update - Wednesday, March 11, 2026
It's been another back and forth, yo-yo kind of day for U.S. equities. There's been a little good news technically, and a little not-so-good news. First, the Dow Jones ($INDU) has been under pressure all day and, after a little bounce over the past 2-3 hours, the INDU is "only" down 335 points, or -0.7%. From there, the other major indices are slightly better off, with the NASDAQ performing best today, currently down just 0.10%. That relative strength in the NASDAQ has been due primarily to outperformance in technology shares (XLK, +0.26%), one of only two sectors higher on the session. Energy (XLE, +2.07%) is gaining nicely, mostly as a result of rebounding crude oil prices ($WTIC, +5.15%), which are now back near $88 per barrel again.
The growth vs. value (IWF:IWD) proposition has improved greatly of late, especially after the positive divergence printed from just over one week ago:
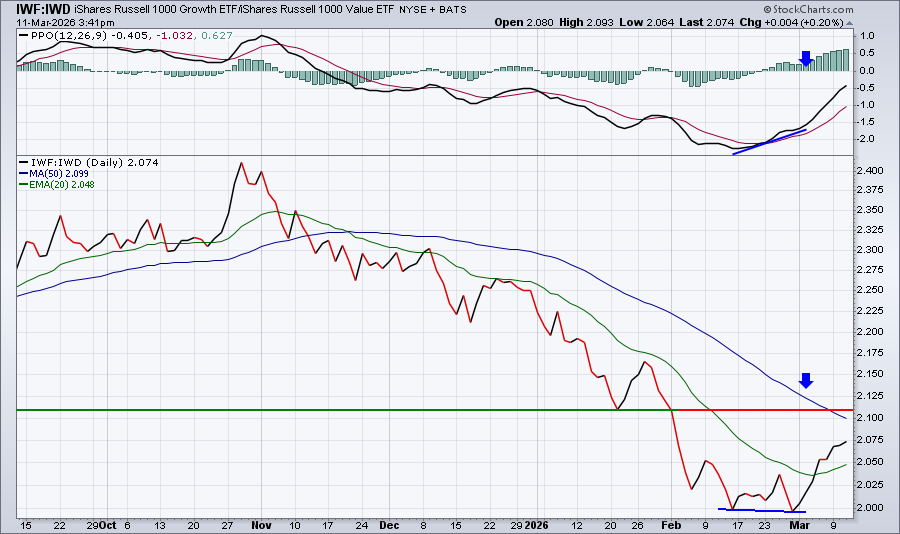
This is a reprint of what was provided in the DMR 8 days ago on Tuesday, March 3rd. The positive divergence has "played out" with the IWF:IWD ratio nearing the 50-day SMA and its PPO has nearly "reset" back at its centerline. Now it's time to sit back and watch to see if growth can muster up further relative strength to trigger a significant breakout ABOVE both PPO centerline resistance and the 50-day SMA. Doing so would add more bullishness to the underlying strength of the recent rally. I believe this rotation back into growth and the soaring AD lines in many areas of the market is evidence that selling in 2026 will not be severe (ie, doubtful we see a cyclical bear market, or 20% decline).
Unfortunately, that does NOT mean that we do not have further downside and choppiness ahead. On the S&P 500, the two biggest levels of price support, in my view, will be 6540 and then 6144. To the upside, the recent all-time high and the psychological resistance lies squarely at 7000.
Happy trading!
Tom