
EB Daily Market Report - Thursday, March 12, 2026
Executive Summary
- Futures were again lower overnight and our major indices started the day in negative territory
- Selling is mostly across-the-board with relative weakness found in the small cap Russell 2000 (IWM, -1.89%)
- The rising 10-year treasury yield ($TNX), up 7 basis points to 4.27%, could be one reason
- Energy (XLE, +1.38%) and utilities (XLU, +1.12%) are the only two sectors gaining ground today
- Crude oil ($WTIC, +10.02%) is surging again after Iran's new Supreme Leader said the Strait of Hormuz must remain closed
- Industrials (XLI, -2.03%) are leading 9 sectors lower today, with transportation stocks ($TRAN-2.43%) getting hit particularly hard
- Truckers ($DJUSTK, -4.98%) and airlines ($DJUSAR, -4.03%) are very weak
- Adobe Systems (ADBE, -1.34%), a $112 billion software company ($DJUSSW, -0.48%), will report its latest quarterly results after the closing bell today
Market Outlook
While it's no fun watching the market slowly deteriorate, this weakness is helping to start resetting sentiment. Traders have been much too complacent and the only way to change things, unfortunately, is to go through challenging periods like the one we're in. Below is the S&P 500 rolling over, but check out the 50-day SMA of the equity only put call ratio in the panel below the price chart:
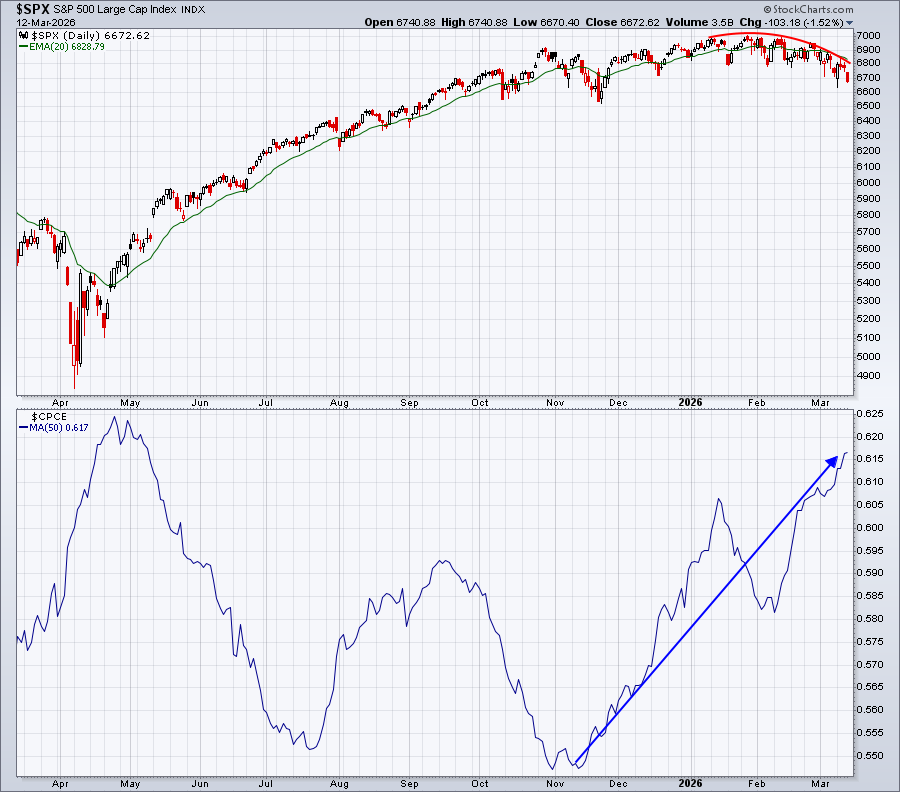
We've nearly grown as bearish in the options world as we were back in April 2025. If we see more choppiness, or even further selling, in the days and weeks ahead, this 50-day SMA should reach the high from April and possibly even surpass it. That would help us mark a definitive bottom.
Sectors/Industries
I'm not too surprised to look at today's leaderboard and see utilities (XLU) up there with energy (XLE). Remember from our March Seasonality Report, the XLU loves March and has outperformed the S&P 500 during March nearly every year in this secular bull market. Here's a quick look at XLU's bounce off its rising 20-day EMA:
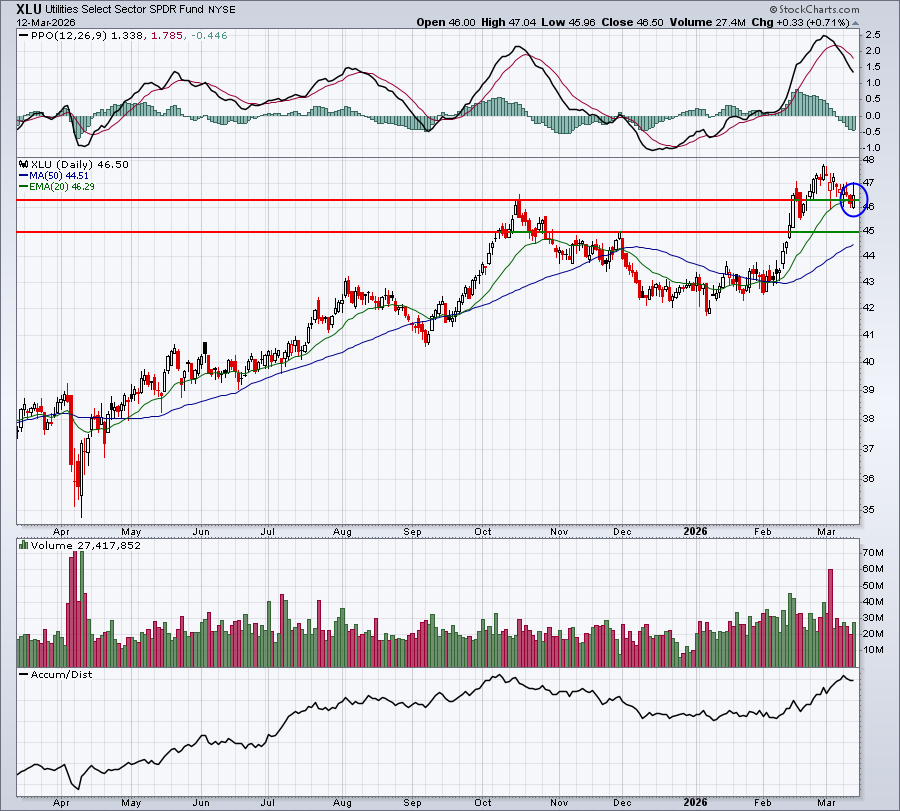
In the bottom panel, you can see that the AD line on the XLU is also moving solidly higher - as it is across nearly every major index and sector.
ChartLists and Trading Strategies
I'm continuing to keep my trading powder mostly dry. I'll occasionally pull the trigger on an ETF or individual stock trade, but it's not very often. The Volatility Index ($VIX) is up nearly 8% and back above 26. A VIX over 20 and in an uptrend spells D-A-N-G-E-R to me. Yes, the high volatility can create big profit opportunities, but the same can be said for opportunity for big losses. I'm perfectly content keeping my trading capital intact for sunnier days ahead.
Upcoming Earnings
Our Upcoming Earnings ChartLists and Upcoming Earnings Relative Strength ChartList are included on our website.
Economic Reports
Initial jobless claims: 213,000 (actual) vs. 215,000 (estimate)
February housing starts: 1,490,000 (actual) vs. 1,350,000 (estimate)
February building permits: 1,380,000 (actual) vs. 1,410,000 (estimate)
Happy trading!
Tom