
EB Daily Market Report - Tuesday, March 17, 2026
Executive Summary
- Futures were weak, but improved overnight and turned positive this morning
- Our major indices all gapped higher and moved to 4-day highs in early action
- We've since weakened with both health care (XLV, -0.55%) and industrials (XLI, -0.24%) turning negative
- Energy (XLE, +1.86%) is easily the strongest sector as crude oil ($WTIC, +2.18%) has moved back above $95 per barrel; it earlier topped $100
- The 10-year treasury yield ($TNX) has moved slightly lower to 4.20% as the bond market awaits the Fed's latest policy announcement
- February pending home sales came in well above estimates, rising 1.8% vs. an expected drop of 1.0%
- It's important to note that its options-expiration week for March, or what I like to refer to as "Opposite George" week (Seinfeld reference), a week where short-term reversals could be more likely
- In that regard, many industries with low SCTR (StockCharts Technical Rank) scores are rallying; travel & tourism ($DJUSTT, +4.01%) is a perfect example
- Lululemon Athletica (LULU, +0.91%) is reporting its latest quarterly results after today's closing bell; relative weakness suggests there could be bad news
Market Outlook
The Federal Reserve began its latest 2-day meeting this morning, with expectations at nearly 100% for no rate change when Fed Chief Powell announces the FOMC policy decision at 2:00pm ET on Wednesday.
Banks ($DJUSBK) have been weak, but their AD lines do suggest there are plenty of buyers as the group, overall, continues to trek lower:
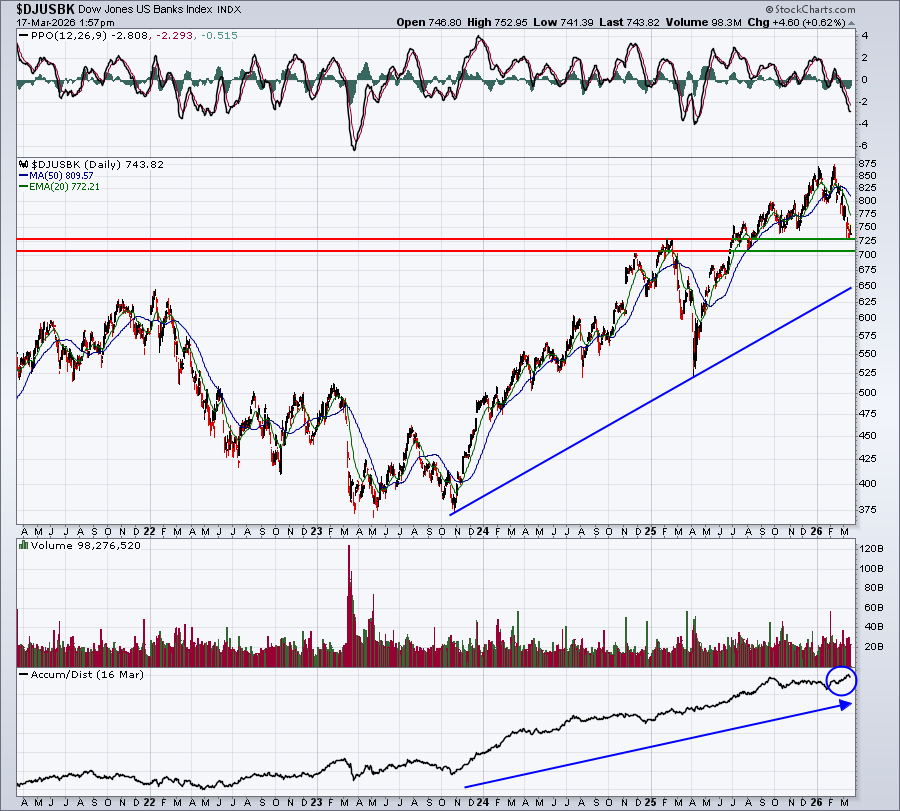
The blue circle on the recent AD line is evidence that buying interest remains. And while it's easy to only look at 2026 and draw bearish conclusions about the group, this longer-term 5-year chart tells a much different story. This longer-term trend is clearly UP. Personally, I just think we need to be patient. If short-term selling is somewhat contained, then the DJUSBK could very well hold the two support lines drawn at slightly above 700 and again near 725. Those are two levels to watch. If selling accelerates, the VIX moves well into the 30s, and fear escalates, then a test of the blue uptrend line could come into play. That would likely accompany a drop in the S&P 500 well into correction territory, possibly testing the breakout level of 6144.
We knew heading into this year that it would be a very challenging environment. Once this period of instability and fear dissipates, I fully expect the S&P 500 to move higher and set new all-time highs. It's just a matter of "how bad does this get" before then.
Sectors/Industries
I mentioned "Opposite George" week above. It's that time of the calendar month when previously-strong areas of the market take a break, while recent laggards all of a sudden come back to life. As an example, look at the various industry groups within the industrials today:
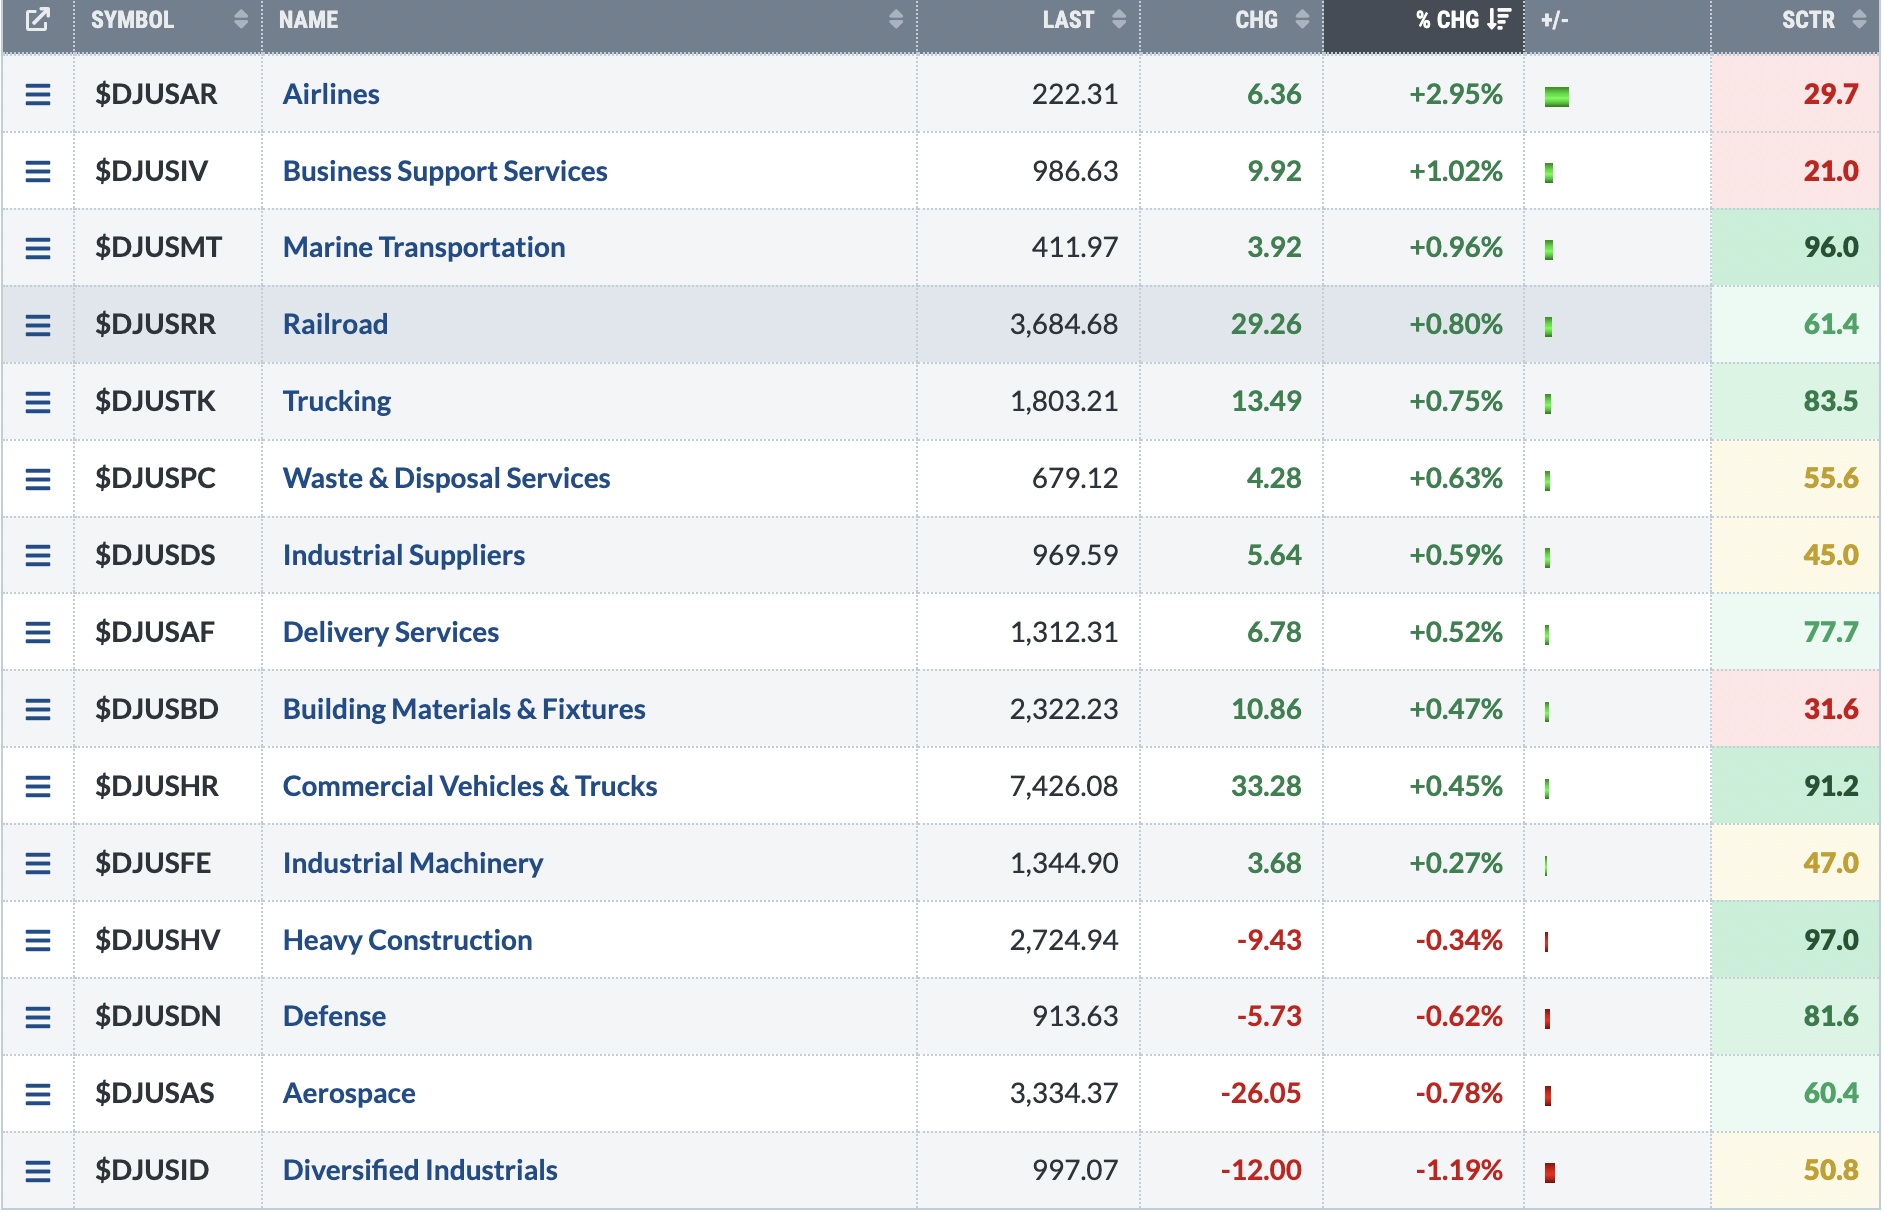
The two weakest industry groups in this sector, at least based on SCTR scores, are business support services ($DJUSIV) and airlines ($DJUSAR), with SCTR scores of 21.0 and 29.7. respectively. They're performing best today, while two groups that have been big winners over the past year, heavy construction ($DJUSHV) and commercial vehicles & trucks ($DJUSHR), are among the worst performers.
Options are a "thing." Market makers stand to make or lose money on options and, in most cases, they make money by pulling the rug out from under options traders just before options expire. They may be getting an early start this week.
ChartLists and Trading Strategies
I'm remaining on the sidelines for now.
Upcoming Earnings
Our Upcoming Earnings ChartLists and Upcoming Earnings Relative Strength ChartList will be updated and included on our website when Q1 earnings reports begin kicking off in mid-April.
Economic Reports
February pending home sales: +1.8% (actual) vs. -1.0% (estimate)
Happy trading!
Tom