
EB Daily Market Report - Thursday, March 19, 2026
Executive Summary
- Futures were lower overnight as our major indices gapped down at the opening bell, extending the recent selloff
- U.S. stocks have reversed off lows, however, especially the small cap Russell 2000 (IWM, +0.79%), which turned positive this afternoon
- Energy (XLE, +1.53%) is strong again, with crude oil prices ($WTIC, -2.10%) retreating this afternoon back to $94 per barrel
- Technology (XLK, +0.26%) is the second-leading sector, aiding growth stocks
- Still, 7 sectors are lower on the session, with materials (XLB, -1.54%) clearly the weakest
- Aluminum ($DJUSAL, -8.71%) and gold mining ($DJUSPM, -7.57%), two very strong groups over the past year, are tumbling
- It's been a particularly rough March for gold ($GOLD) as the dollar has rallied
- The 10-year treasury yield ($TNX) threatened a breakout above 4.32%, before reversing back to 4.28%
- FedEx (FDX, +1.55%) is set to report its latest quarterly results after the bell today; relative strength suggests the company will have good news
Market Outlook
The S&P 500 continued to drift lower earlier as we saw another gap lower to begin today's session. At its morning low, the S&P 500 was nearing perhaps its biggest intermediate-term price support level at 6538:
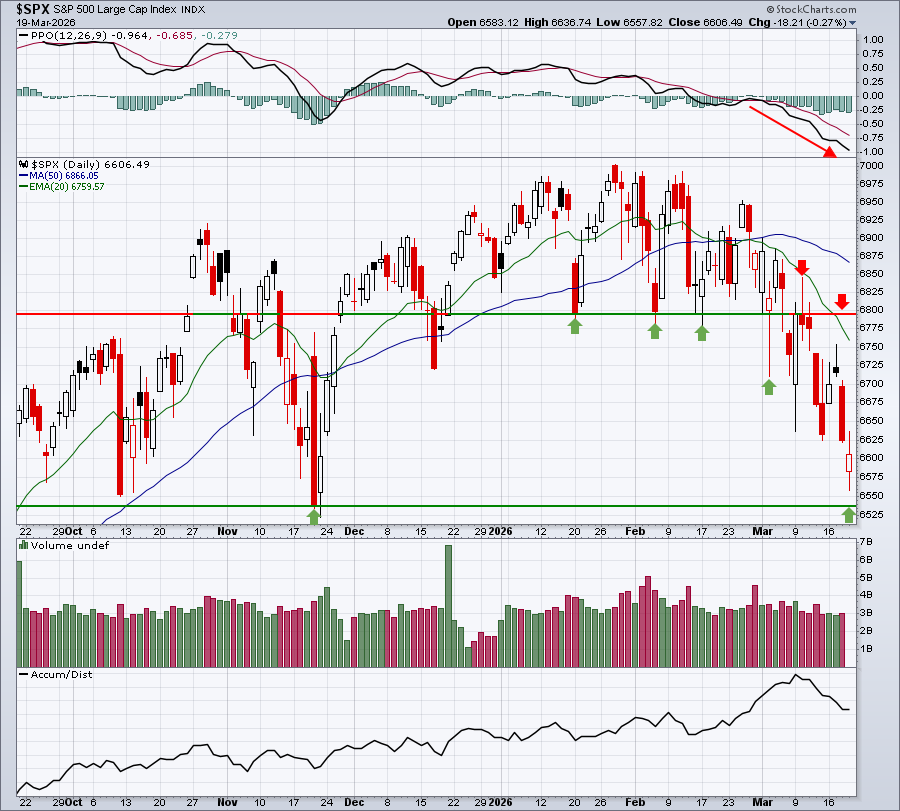
You can see that the S&P 500 performed much better this afternoon after moving within 20 points of support in very early action, which is at least a short-term positive. The range now is 6538-6797. In my opinion, as long as the S&P 500 does not close beneath 6538, I can argue that it remains in an uptrend. Failure to hold that closing support, however, would bring the uptrend into question and certainly open up the S&P 500 to further downside and, most likely, the correction that I discussed at MarketVision 2026 in January. Given the range, it's not out of the question for the S&P 500 to stage a rally from here to move into the top of the current trading range, but I'm mostly interested to see which side of the range we eventually break out of.
Sectors/Industries
It hasn't just been a sell off in the stock market. Bonds have taken a lick too, with corresponding yields rising to their highest level in months. The good news is that both markets have seen a rebound this afternoon. The 10-year treasury yield ($TNX) pushed above 4.32% for the first time in the last 6 months. The last time we saw that happen was in August 2025. Here's the latest look at the TNX:
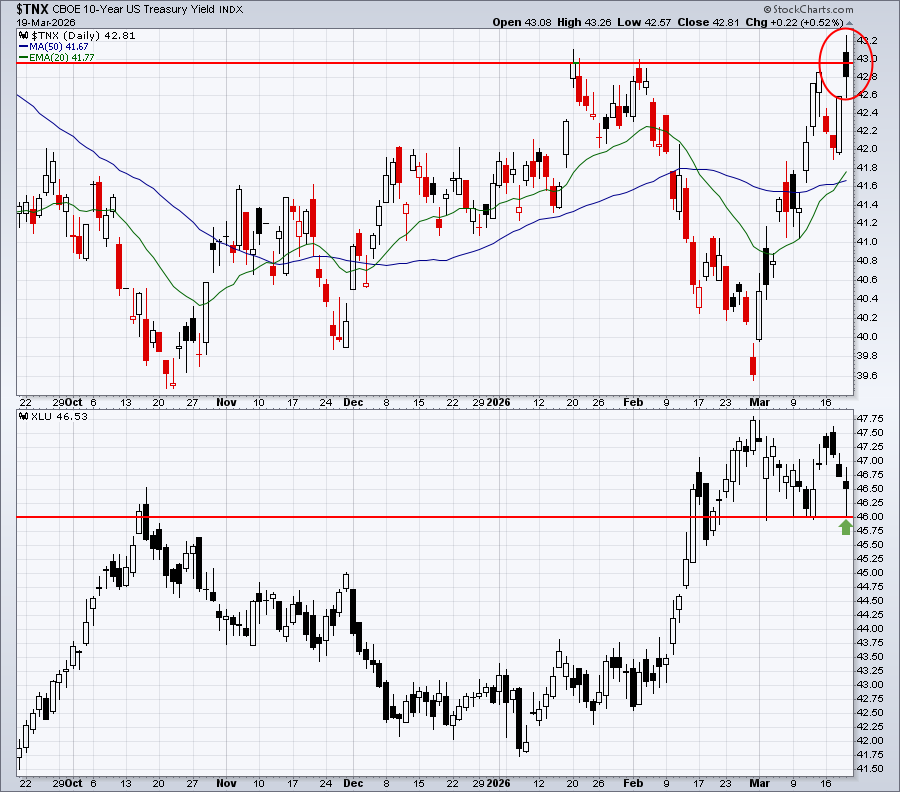
One area that typically benefits from a top in the TNX and subsequent downtrend is utilities (XLU), which is shown in the bottom panel of the chart above. The XLU has also reversed after testing recent price support near 46. The XLU has a long history of performing very well during the month of March, so if the TNX does, in fact, top and start to roll over, then it's fairly likely that we'll see the XLU perform well in the days ahead.
ChartLists and Trading Strategies
Aggressive traders could look at today and decide to take on long positions, in hopes of a move back towards the upper end of the 6538-6797 trading range. Just understand that this strategy involves considerable risk, because we don't know what tomorrow morning might bring. The war in Iran is a wild card for sure and any news sending crude oil prices higher could spook the market.
Having said that, however, here's a stock that looks like a bounce candidate:
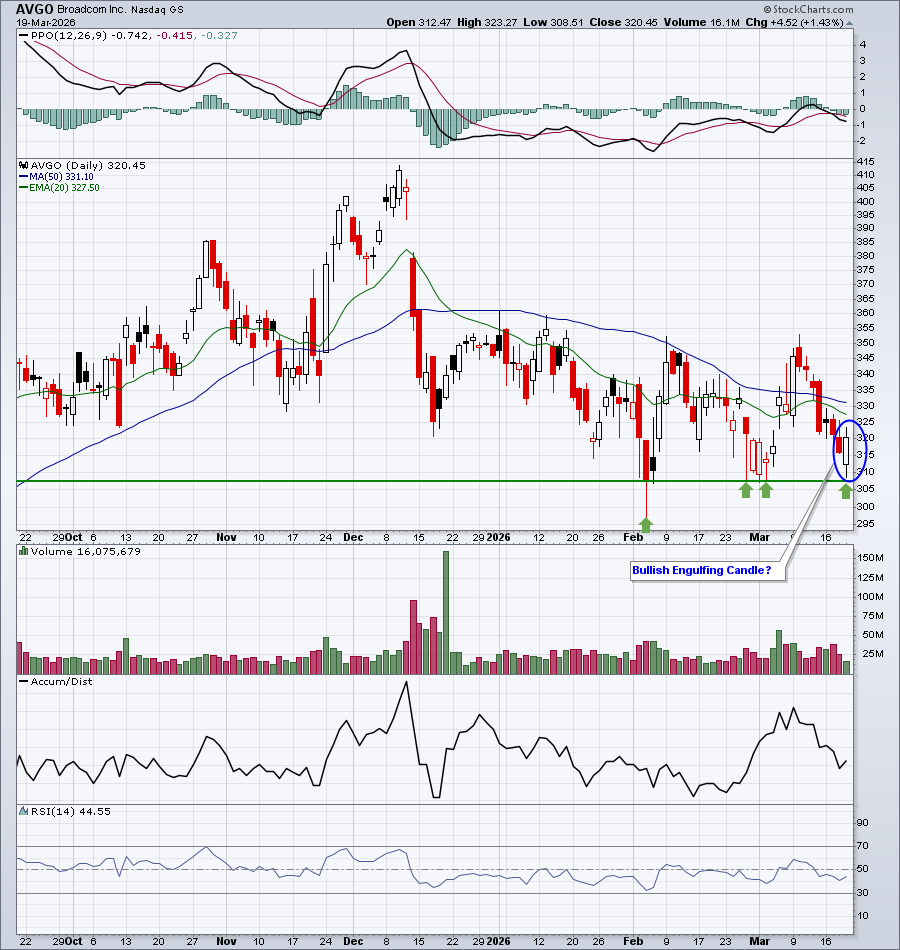
Broadcom (AVGO) has been sideways consolidating with excellent price support just below 310. With today's low of 308.51 and a potential bullish engulfing (or piercing) candle printing, AVGO could certainly be poised for a quick pop back towards 350-355, if the overall market cooperates. Therein lies the risk. Does the market cooperate or do get more bad news out of Iran overnight?
Upcoming Earnings
Our Upcoming Earnings ChartLists and Upcoming Earnings Relative Strength ChartList will be updated and included on our website when Q1 earnings reports begin kicking off in mid-April.
Economic Reports
Initial jobless claims: 205,000 (actual) vs. 215,000 (estimate)
March Philadelphia Fed manufacturing survey: 18.1 (actual) vs. 8.4 (estimate)
January wholesale inventories: -0.5% (actual) vs. +0.2% (estimate)
January new home sales: 587,000 (actual) vs. 719,000 (estimate)
Happy trading!
Tom