
EB Daily Market Report - Thursday, March 26, 2026
Executive Summary
- Futures were lower overnight as optimism over a quick Middle East resolution faded
- Crude oil prices ($WTIC, +5.45%) were once again rising, this time back above $95 per barrel
- Energy stocks (XLE, +1.71%) were the obvious winners from the increasing doubts of a quick fix
- The 10-year treasury yield ($TNX) was once again on the move higher as well, jumping 9 basis points to 4.42%, despite an "in line" initial jobless claims number
- Cryptocurrencies were down mostly in the 5-6% range, though bitcoin ($BTCUSD, -3.55%) did show a bit of relative strength; this was a further sign, however, of the "risk off" market environment that we're in today
- Commodities, other than crude, were under considerable pressure as gold ($GOLD, -3.81%) and silver ($SILVER, -7.11%) are being hit hard
- The aggressive sectors, led by technology (XLK, -2.71%) are down significantly today, adding to the bearishness of the weak major indices
- Within technology, electronic equipment ($DJUSAI, -5.26%) and electrical components & equipment ($DJUSEC, -4.43%) are having their most bearish days in months - and they've been among the market's leaders for over a year
Market Outlook
The S&P 500 is under significant selling pressure once again with the Volatility Index ($VIX) surging over 12% to 28.46 at last check. Remember, a rising VIX in the 20s and especially the 30s or higher, can trigger very impulsive selling as market makers "go on vacation" and fail to provide near-term liquidity. That leaves panicking sellers with few buyers, resulting in much larger losses.....and sometimes very quickly. Simply refer back to the 3 days leading up to the April 2025 cyclical bear market bottom, if you need a refresher on what CAN happen. I'm perfectly content sitting in cash, realizing that my buying power increases with each drop in the S&P 500.
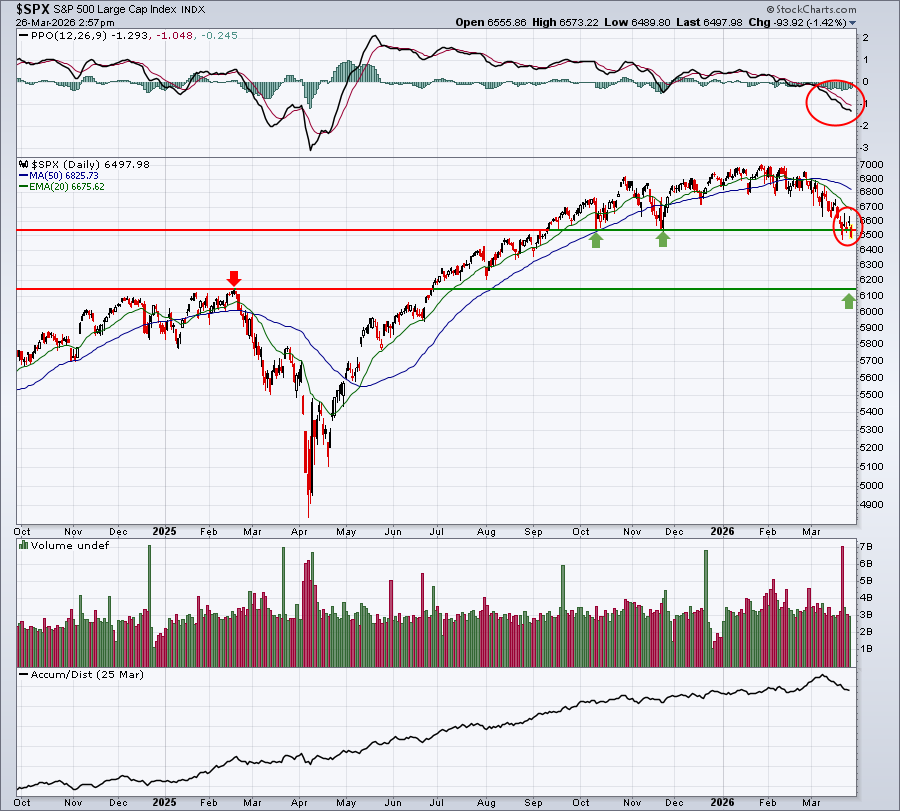
Recently, I pointed out that 6538 and 6144 were the two key upcoming price support levels. 6538 was lost last week and with encouraging comments from President Trump earlier this week regarding the potential end to the Middle East conflict, we witnessed a not-too-inspiring rally ensue. The declining 20-day EMA was not even tested, however, and now we find ourselves on the doorstep of another price breakdown. Not good.
If you recall, the S&P 500's all-time high, prior to the cyclical bear market from February to April 2025, was 6144. That level is now the level I'm watching for support at some point in the next few days to few weeks or months. A drop to 6300 would represent a 10% drop, which is the level most folks use to determine a market "correction". Here's the current chart:
Sectors/Industries
A big piece of the market's troubles over the past few months has been the relative weakness in a number of the Mag 7 names - Microsoft (MSFT), Meta Platforms (META), Alphabet (GOOGL), and Tesla (TSLA) immediately come to mind. Check out each of their charts and, while doing so, realize that these four stocks account for nearly 15% of the entire S&P 500:
MSFT:
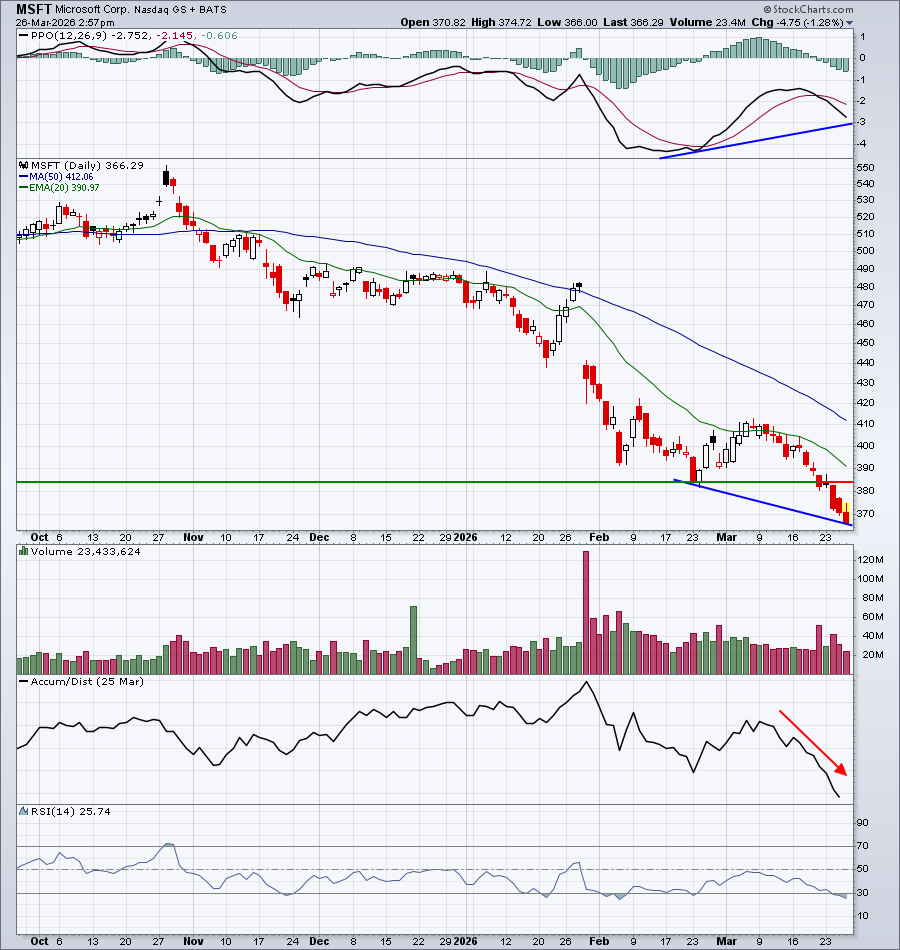
MSFT is just drifting lower and lower every day and appears poised to test the April 2025 low in the 340-350 area. The good news is that if MSFT does test that level and prints a reversing candle, there's a positive divergence in place that could provide a short-term boost all the way back to its 50-day SMA. Patience may be required to allow further downside action first, however.
META:
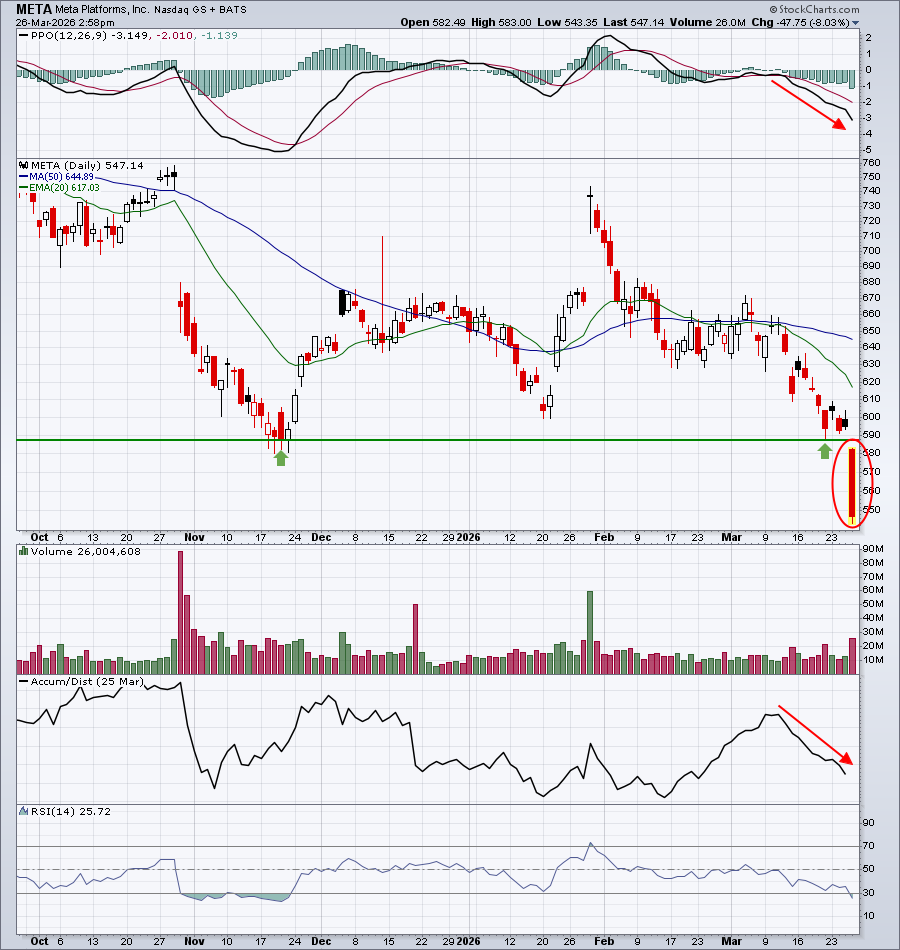
Today is a clear breakdown on increasing volume. There's nothing bullish about this candle. Like MSFT, I don't see a whole of support until META reaches its April 2025 low around 480.
GOOGL:
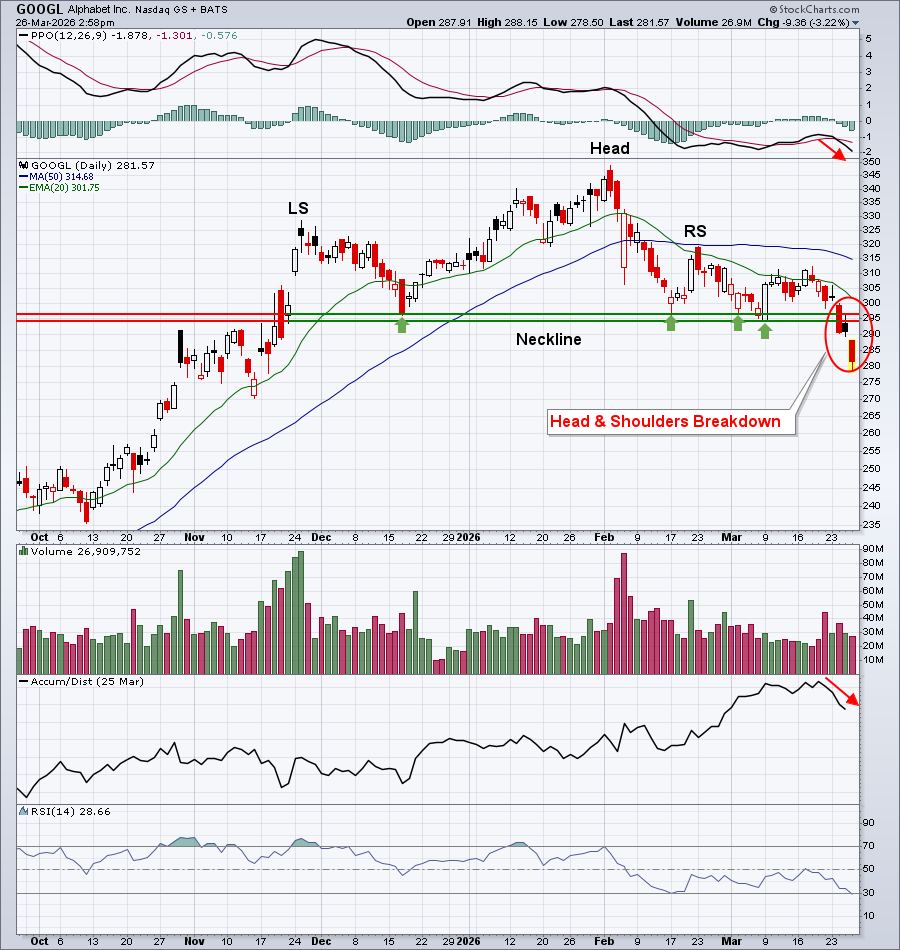
You could certainly draw a neckline to connect GOOGL's December and February lows. Doing so would suggest that this week's selling has triggered a bearish head & shoulders breakdown, evidence of much more selling ahead.
TSLA:
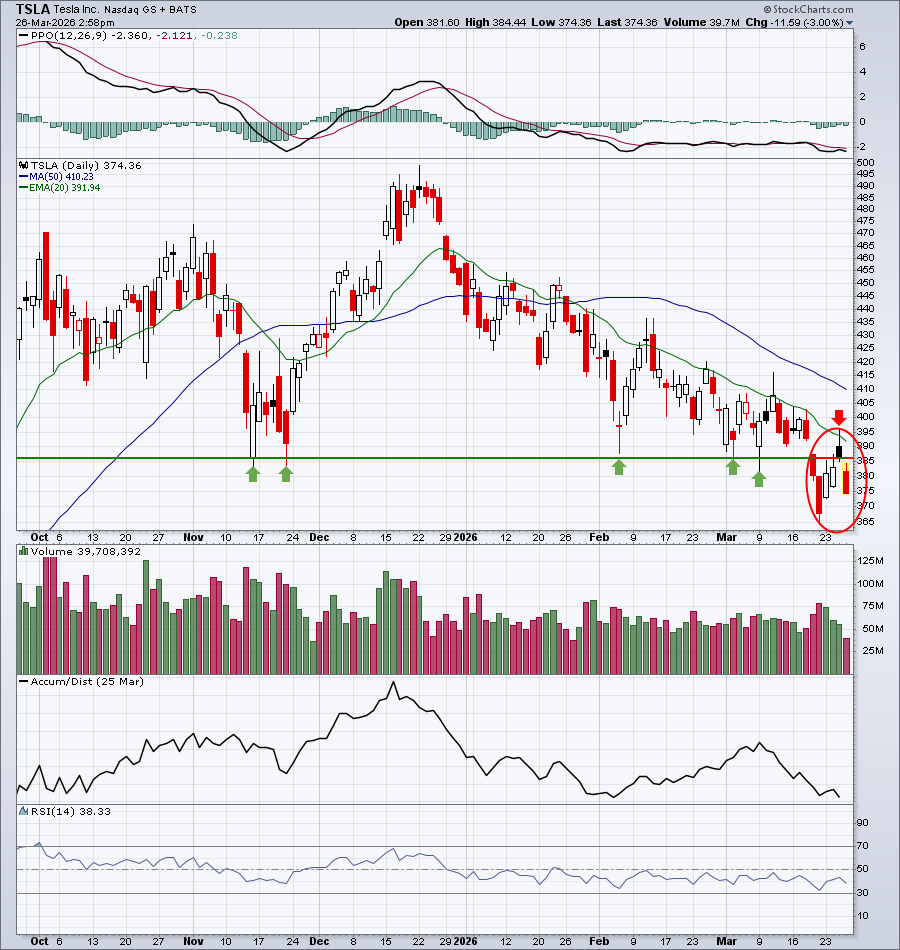
TSLA keeps gaining enough strength to test its 20-day EMA, but not enough to clear it. Meanwhile, it keeps printing lower lows. Its May 29th high close of 358.43 became support when TSLA cleared that resistance in September on very heavy volume. I'd look for a reversing candle after testing that support.
ChartLists and Trading Strategies
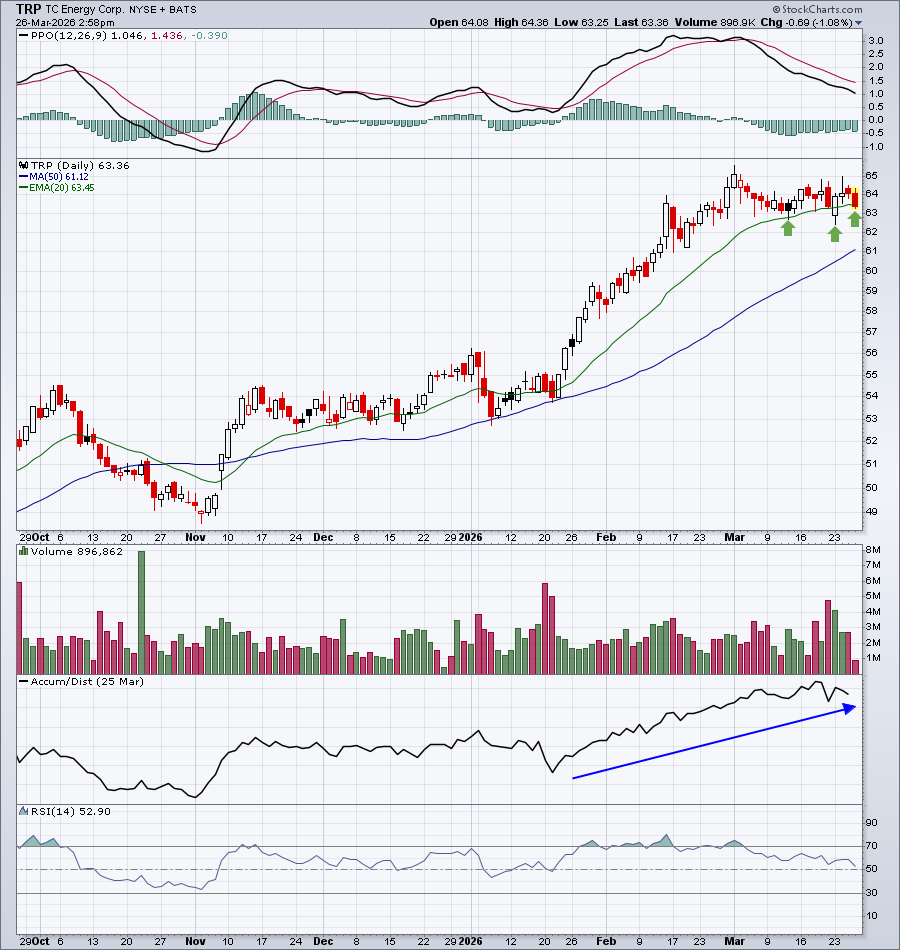
Energy (XLE) and utilities (XLU) are the two best sectors currently, with the former having a huge advantage in technical strength. If I were to take long positions, which I am not, it would likely be an energy name pulling back to price or moving average support. One pipeline ($DJUSPL) stock that perhaps fits the bill is TC Energy Corp (TRP), which has successfully tested its 20-day EMA in recent sessions, including today, and doesn't reside too far above this key moving average:
Upcoming Earnings
Our Upcoming Earnings ChartLists and Upcoming Earnings Relative Strength ChartList will be updated and included on our website when Q1 earnings reports begin kicking off in mid-April.
Economic Reports
Initial jobless claims: 210,000 (actual) vs. 210,000 (estimate)
Happy trading!
Tom