
EB Daily Market Report - Wednesday, April 1, 2026
Executive Summary
- Futures were strong overnight and our major indices gapped up for the second consecutive day
- Key 20-day EMA tests were made earlier today and, thus far, the bulls have failed to clear this important moving average
- Industrials (XLI, +1.93%) and technology (XLK, +1.26%) are leading on a relative basis today as 9 of 11 sectors are higher
- Energy (XLE, -4.02%) is easily the worst-performing sector
- The 10-year treasury yield is flat on the session, rising less than 1 basis point to 4.32%
- While the XLE is taking a big hit, crude oil ($WTIC, -1.45%) still trades at $100
- Nike (NKE, -15.06%) trades down sharply after disappointing with its forecast
- Aluminum ($DJUSAL, +6.96%) is trading at its highest level since April 2022
- Gold mining ($DJUSPM, +5.30%) continues its rebound as the U.S. dollar (UUP, -0.45%) pulls back from its 52-week high
Market Outlook
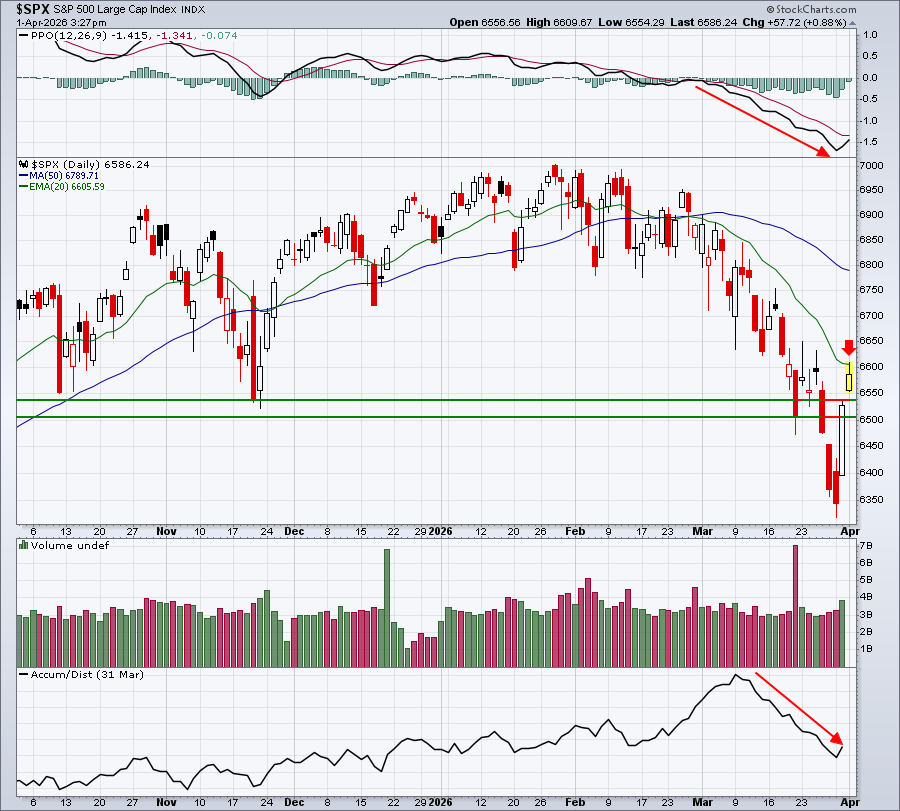
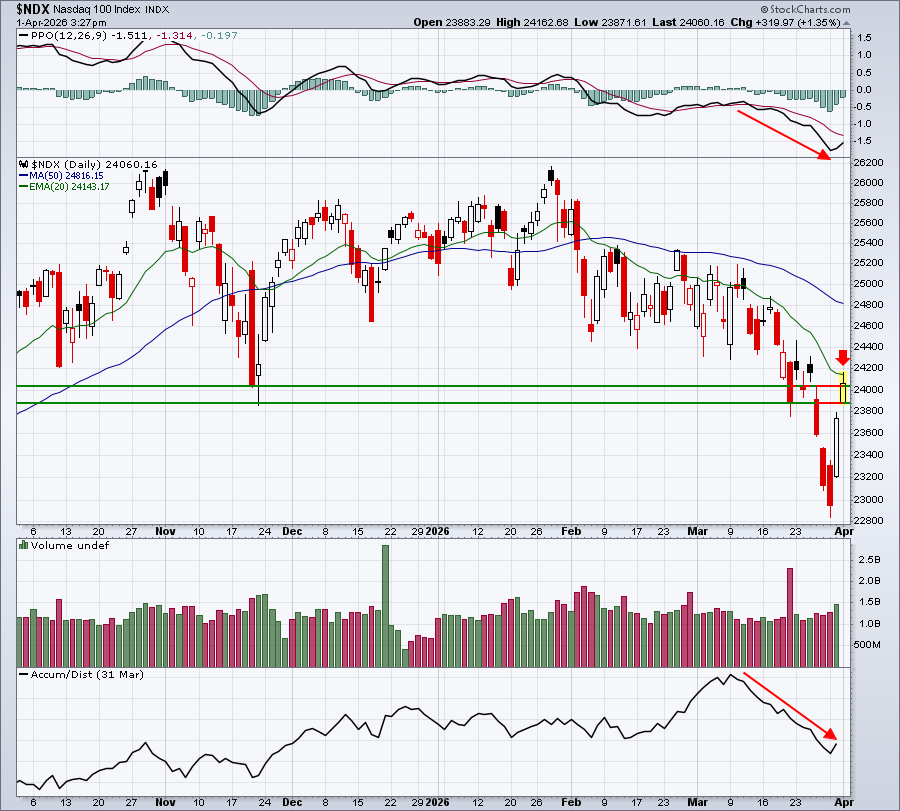
In my opinion, the bulls rebound attempt is being tested for the first time as prices have risen this week up to declining 20-day EMAs. Thus far, the bulls have failed in their attempt to regain control of the short-term market action. Take a look:
S&P 500:
NASDAQ 100:
Russell 2000 (IWM):
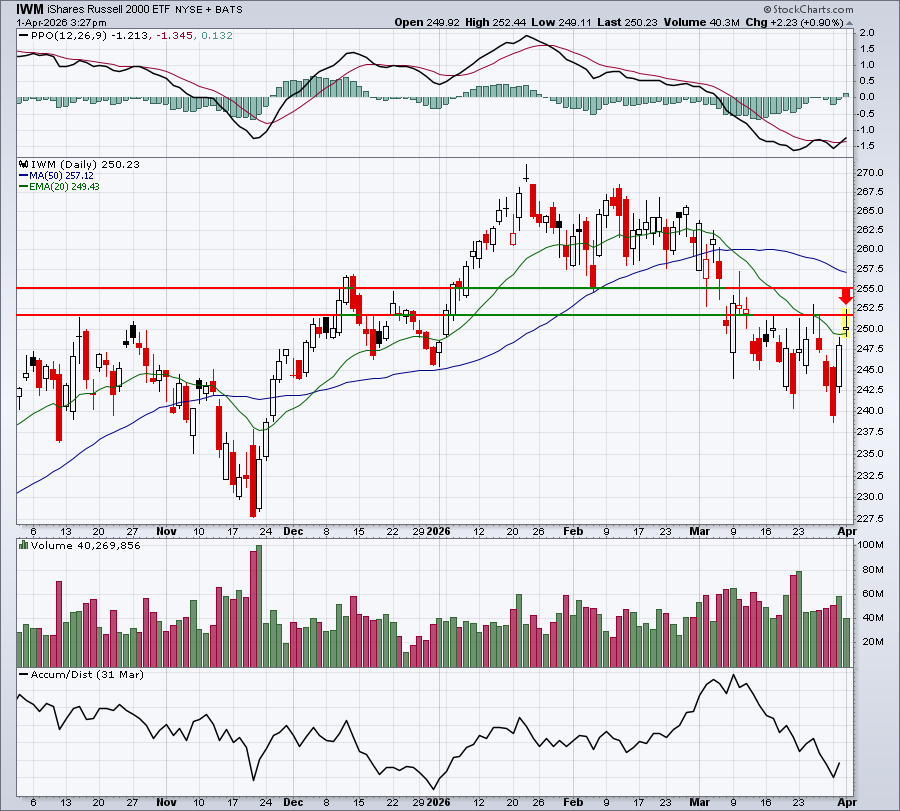
When a downtrend is in play and the PPO remains weak (setting new lows to accompany recent price lows), failed 20-day EMAs generally lead to further declines. I say "generally", because nothing is a guarantee. But technically, it's not a good look to leave "tails" (intraday highs) above key resistance like the 20-day EMA and then close below that key level.
Sectors/Industries
Aluminum ($DJUSAL) is making another breakout after sideways consolidating in a bull flag and testing its rising 20-week EMA:
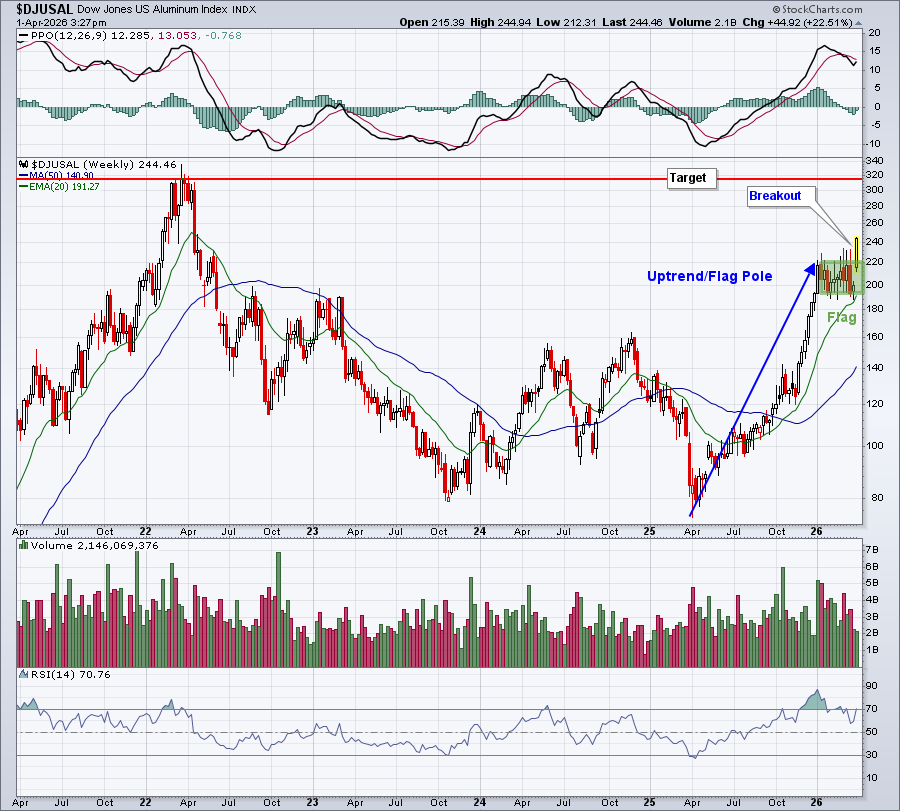
I don't see much resistance on the chart until it reaches its high from Q1 2022.
ChartLists and Trading Strategies
In today's Live Trading Room, I discussed my strategy in trading the SQQQ, which is the 3x leveraged INVERSE ETF that tracks the QQQ. An inverse ETF moves in the opposite direction of the underlying security that it tracks. So.....if the QQQ goes up, the SQQQ is designed to drop 3 times the percentage. A 1% rise in the QQQ would typically result in a 3% drop in the SQQQ.....and vice versa.
My thinking in taking on an SQQQ position is that the QQQ is testing a MAJOR resistance level. If it breaks through, then I would exit the SQQQ with a minor loss. If, however, the QQQ fails to break above key resistance and reverses, the SQQQ would be a super trade to capture gains on such a QQQ reversal. That was the idea. My first purchase of the SQQQ was at 77.19 and I ended up buying at 3 additional levels - at 76.94, 76.49, and at 76.29. Once the QQQ fell back below its 20-day EMA, the selling accelerated and the SQQQ quickly became profitable.
I have no plans of holding much overnight, if any. I sold half of my SQQQ when the first lower low printed on its 5-day 10-minute chart:
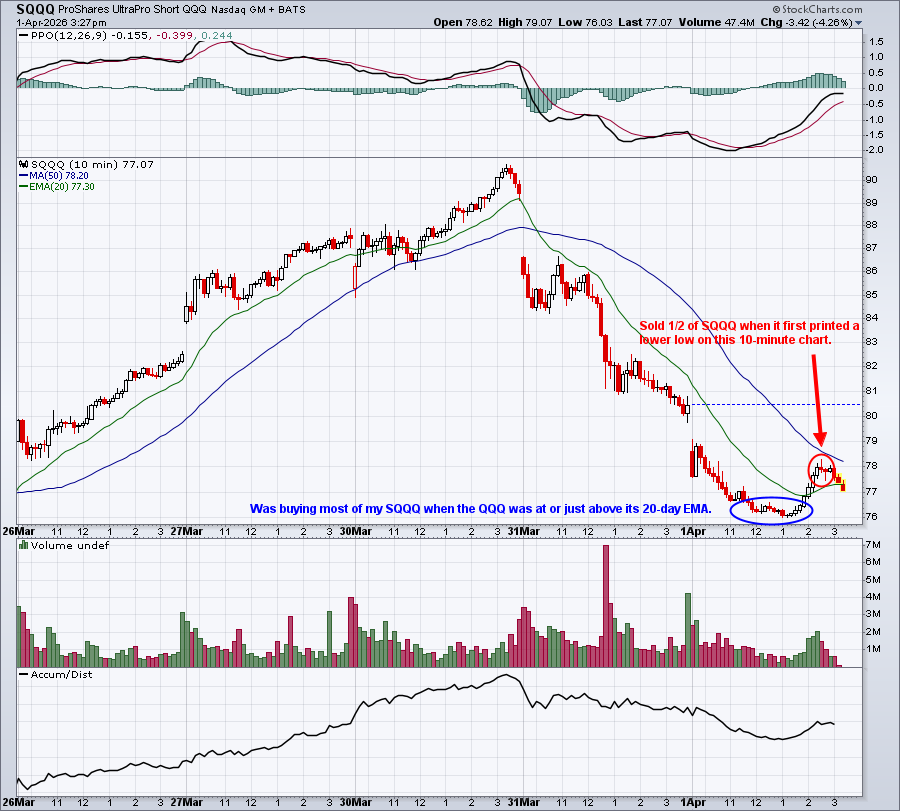
If the SQQQ sells off into the close, I'll exit and be happy with my intraday profits.
Upcoming Earnings
Our Upcoming Earnings ChartLists and Upcoming Earnings Relative Strength ChartList will be updated and included on our website when Q1 earnings reports begin kicking off in two weeks.
Economic Reports
March ADP employment report: 62,000 (actual) vs. 39,000 (estimate)
February retail sales (delayed): +0.6% (actual) vs. +0.5% (estimate)
February retail sales less autos (delayed): +0.5% (actual) vs. +0.3% (estimate)
March PMI manufacturing: 52.3 (actual) vs. 52.4 (estimate)
March ISM manufacturing: 52.7% (actual) vs. 52.1% (estimate)
January business inventories (delayed): -0.1% (actual) vs. +0.0% (estimate)
Happy trading!
Tom