
EB Daily Market Report - Thursday, April 2, 2026
Executive Summary
- Futures were very weak this morning and our major indices gapped down
- After initial early selling, however, buyers emerged across the board
- Real estate (XLRE, +1.56%) is leading the sector leaderboard, while technology (XLK, +0.55%) also shows strength - more on the latter below
- 7 sectors are higher, while just 4 are lower, led by consumer discretionary (XLY, -1.59%)
- Crude oil prices ($WTIC, +10.89%) have soared today to $111 per barrel, yet energy (XLE, +0.47%) is up only fractionally
- Cryptocurrencies are taking another hit, though most remain above key price support from the early-February low
- The gold ($GOLD, -2.23%) and silver ($SILVER, -4.28%) recovery was put on hold today as both have seen profit taking
- Telecommunications equipment stocks ($DJUSCT, +2.22%) remain on a blistering pace as both CIENA Corp (CIEN, +8.06%) and Lumentum
- Holdings, Inc. (LITE, +6.72%) push to new all-time highs
- Tesla (TSLA, -5.75%) is the biggest loser on the S&P 500 today
- U.S. financial markets are closed on Friday in observance of Good Friday
- Nonfarm payrolls will be released, but there'll be no market reaction until Monday
Market Outlook
After President Trump's address to the nation Wednesday night regarding the war in Iran, futures fell. The good news, however, is that after a gap open to the downside this morning, there's been considerable buying that erased all of the losses within an hour. Since then, our major indices have fallen a bit, but are all still well off the early morning lows.
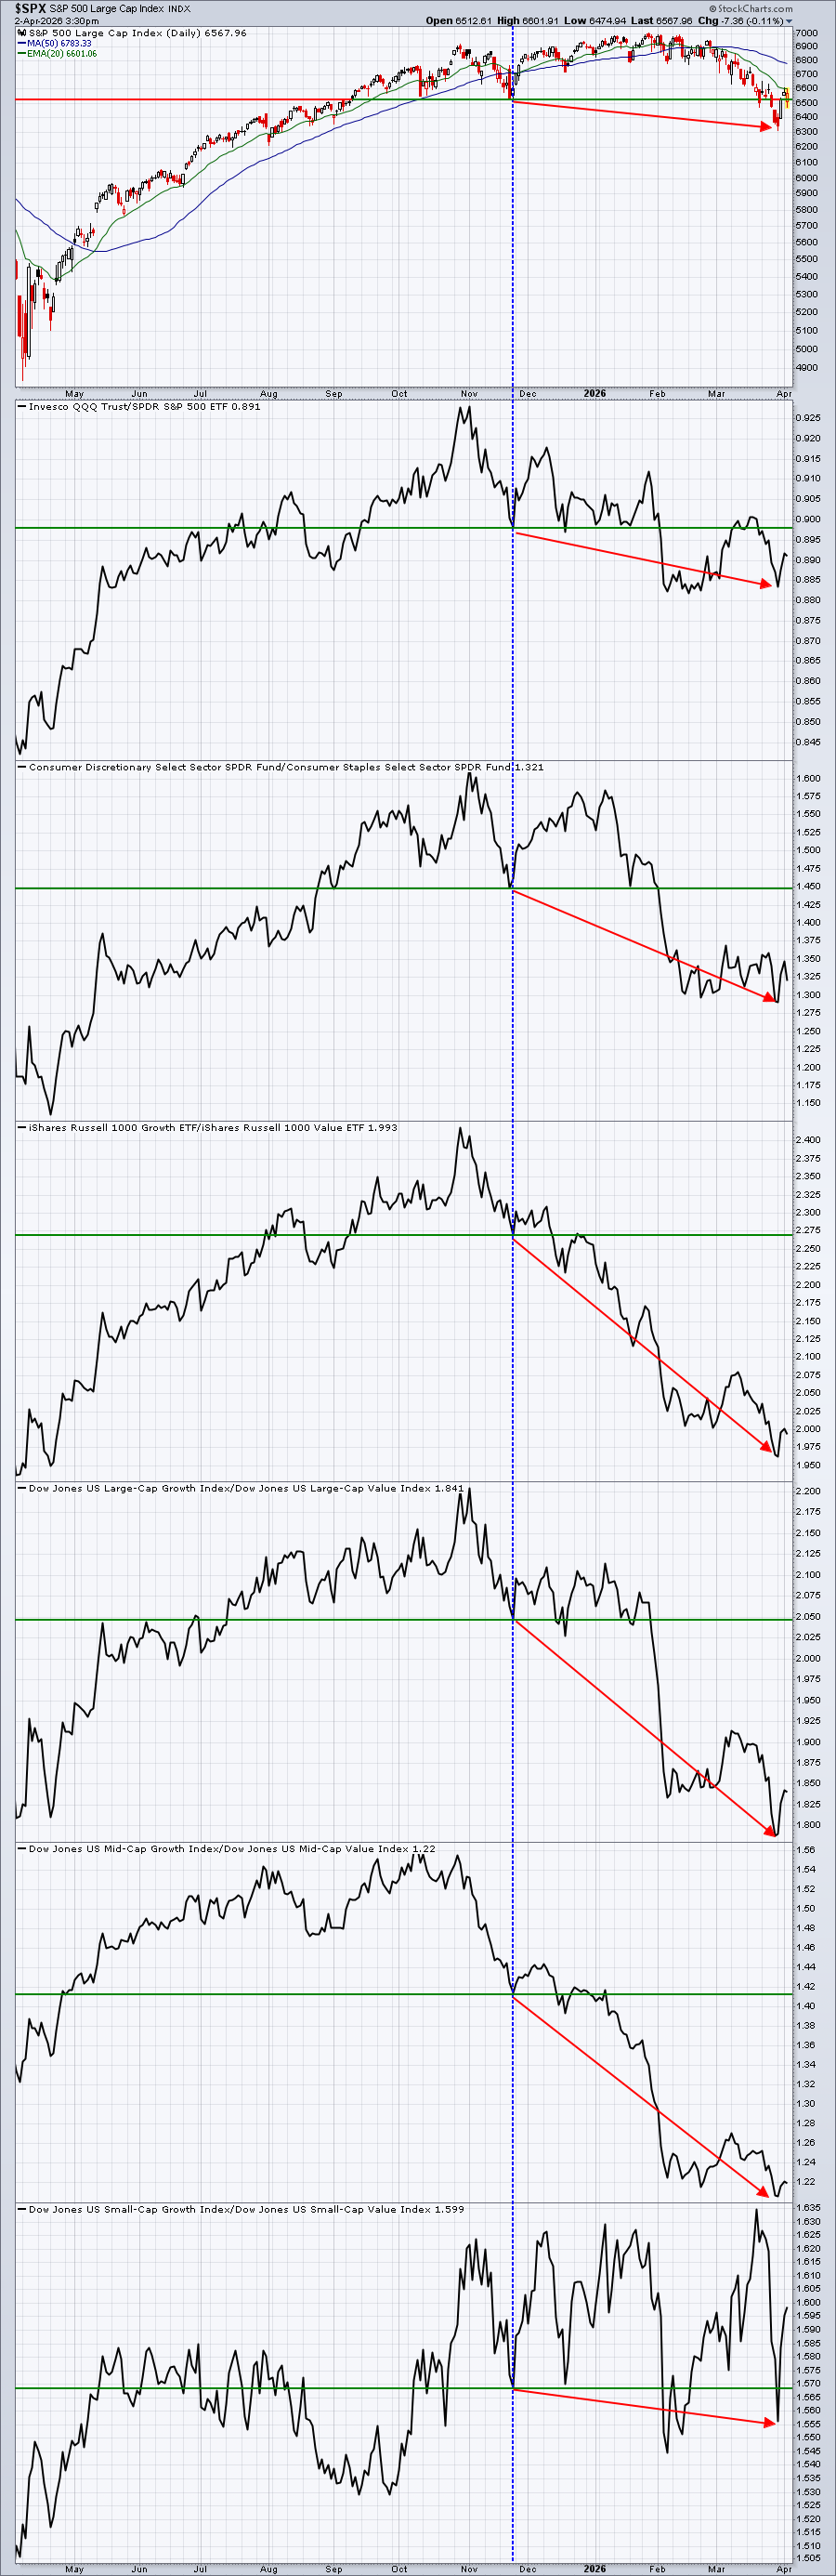
If we compare key sustainability ratios from the key November price low on the S&P 500 to the recent price low on the S&P 500, you can see that not much good has happened. This chart would suggest that we should be expecting lower prices in the weeks, and possibly months, ahead.
Sectors/Industries
Technology (XLK) generally holds the key for the S&P 500, because it has, by far, the largest representation in that benchmark index. So when it's time to evaluate the potential future direction of the S&P 500, the XLK should be evaluated as a primary leader. If you recall, I kept discussing the XLK's major price support in the 134-136 range. Well, that support range was broken. In addition to a myriad of 20-day EMA tests that we've been witnessing over the past couple days, the XLK is also now testing that prior major support zone, which is now a critical resistance zone:
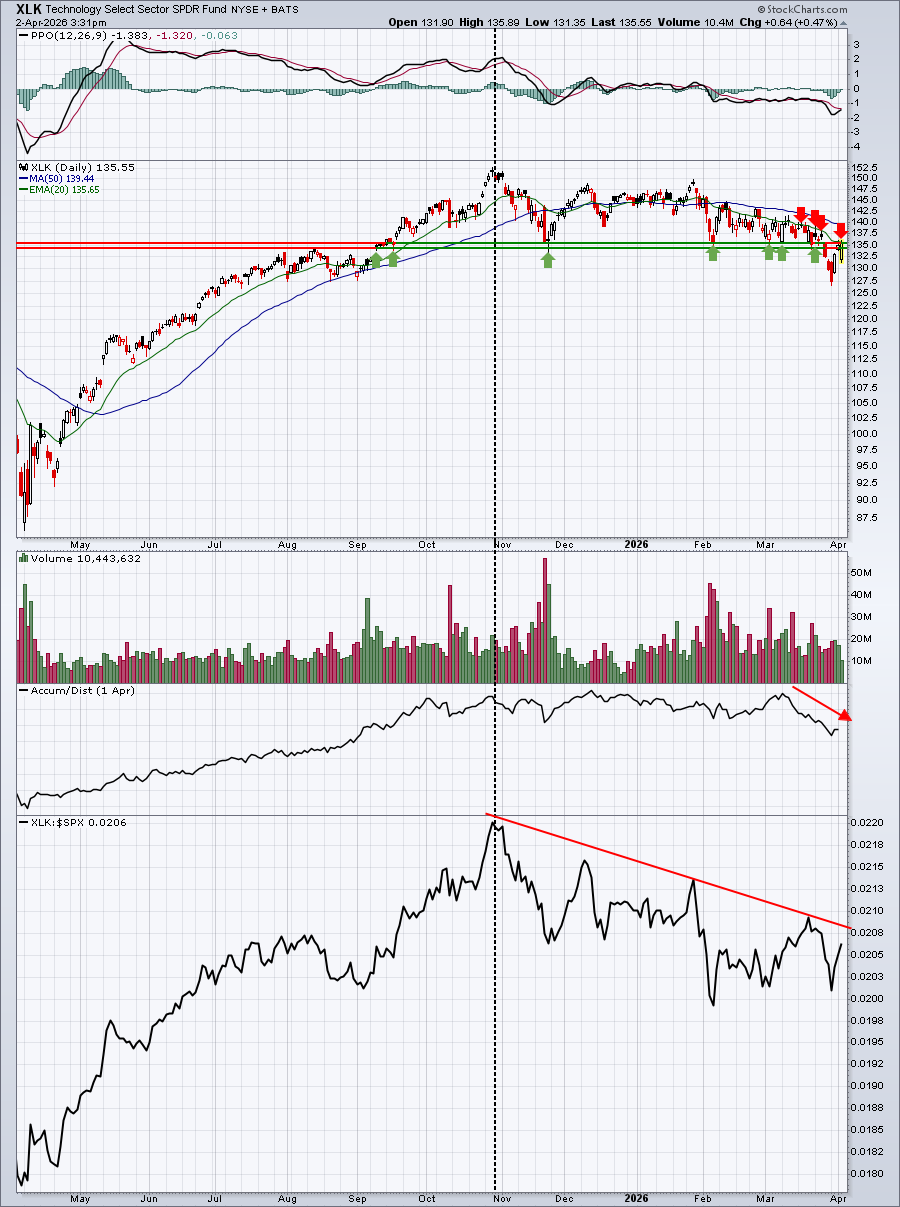
The black-dotted vertical line shows the absolute and relative price high of the XLK all the way back in late October. The S&P 500 struggled to move higher ever since and finally the weight of a faltering technology space was too much for the benchmark as it succumbed to selling pressure throughout March. In order for U.S. stocks to meaningfully rebound, I believe the XLK will need to clear overhead price and moving average resistance. That means a close of at least 136.00. We're close right now, but let's see if the bulls can muster up enough support in the final hour to generate this short-term breakout.
ChartLists and Trading Strategies
I've updated the April Seasonality ChartList, which includes 24 stocks that have historically produced excellent results during the month of April over the past two decades. There are 12 large cap stocks on the list and 12 small and mid cap stocks. Here are the symbols, in order of average April performance:
Large Cap: EQT,AXP,DVN,WAB,AMZN,HAS,PFG,WMB,TT,OKE,NRG,SNA
Mid Cap: CRS,WAL,AN,PAG,EHC
Small Cap: WRLD,LRN,CRK,GPI,GDEN,EZPW,MTRN
The April Seasonality ChartList will be available, with one or two key price support levels annotated, later today.
Upcoming Earnings
Our Upcoming Earnings ChartLists and Upcoming Earnings Relative Strength ChartList will be updated and included on our website when Q1 earnings reports begin kicking off in two weeks.
Economic Reports
Initial jobless claims: 202,000 (actual) vs. 212,000 (estimate)
Happy trading!
Tom