
EB Daily Market Report - Tuesday, April 7, 2026
Executive Summary
- Futures were down overnight and our major indices did gap lower to start the session
- We're currently well off our earlier lows, though still in negative territory
- Energy (XLU, +0.87%) and utilities (XLU, +0.39%) are the best-performing sectors and only two in positive territory
- Crude oil ($WTIC, +3.10%) is on the rise again, helping to fuel those energy stocks
- Consumer discretionary (XLY, -1.63%) and consumer staples (XLP, -1.20%) are laggards just one day after both led the market higher
- Home construction ($DJUSHB, -3.02%) is notably weak as the 10-year treasury yield ($TNX) jumps a couple basis points to 4.35%, continuing its 4-day uptrend
- Aluminum ($DJUSAL, +1.92%) remains one of the strongest industries
- Telecom equipment ($DJUSCT, +1.43%) remains resilient and nears another all-time high
- Two large health care providers ($DJUSHP, +4.97%) are leading the S&P 500 - Humana, Inc (HUM, +8.14%) and Unitedhealth Group, Inc. (UNH, +10.21%)
Market Outlook
The stock market enjoyed one decent day after a strong jobs report last Friday and today market participants are on the defensive again. It's long been known that Wall Street does not like uncertainty and we have plenty of that today. President Trump posted on Truth Social overnight that Iran's "whole civilization will die tonight" unless a deal is struck. Crude oil ($WTIC) has jumped over 3% and resides at $116 per barrel as of 11:30am ET.
Technically, that's left the S&P 500 ($SPX), NASDAQ 100 ($NDX), and most other key indices, trading just below their respective declining 20-day EMAs, an unhealthy short-term place to be trading. Here's a current look at the NDX:
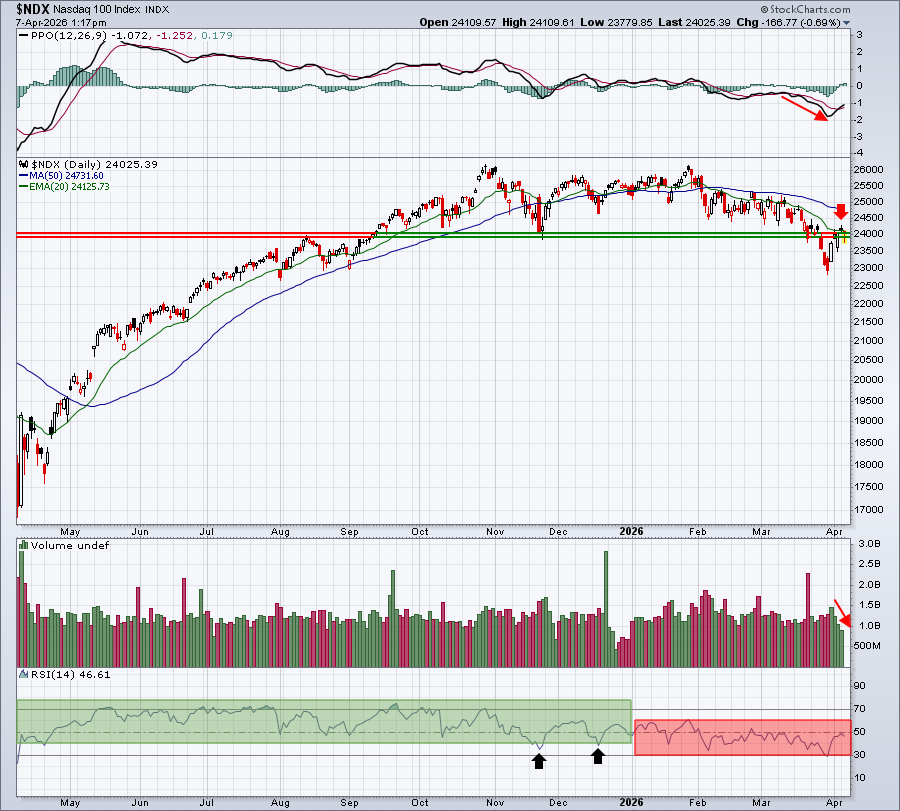
The recent rally back to the 20-day EMA was accompanied by weakening volume, which isn't ideal. Also, the RSI range is now 60 and below (red-shaded area), which is indicative of a downtrending index or security. Note how that's changed from 2025, where the RSI remained mostly above 40 (green-shaded area). The black arrows mark two exceptions where the RSI dipped temporarily below 30. Those could be considered "warning shots fired". The price breakdown simply confirmed the cautious below-the-surface signals we've discussed since December.
Sectors/Industries
Energy (XLE) is bouncing off its 20-day EMA, as leaders typically do after this moving average has been tested:
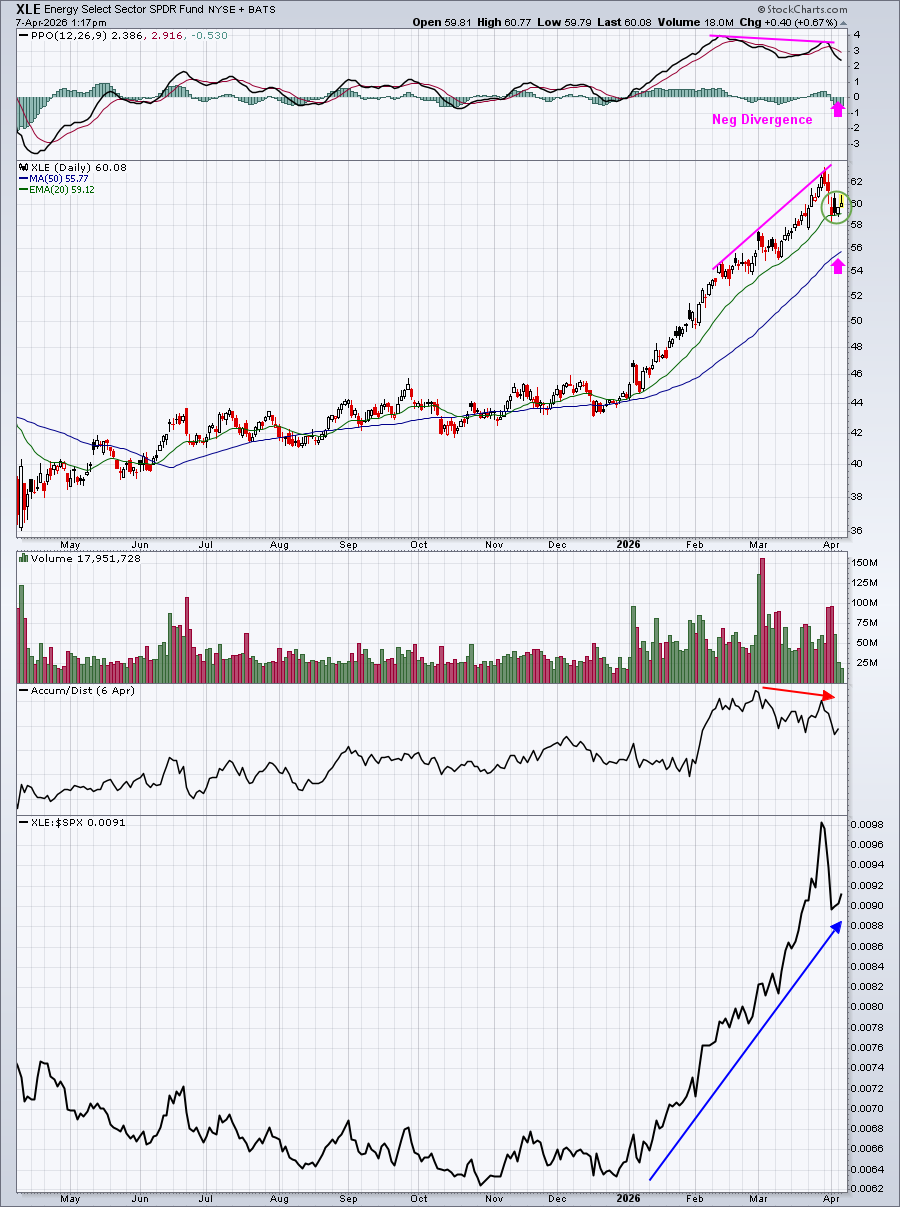
There are warning signs, however, even with the hot energy sector. Note on the above chart that there's a negative divergence in play. That suggests to me that any loss of 20-day EMA support could lead to a 50-day SMA test to "reset" the daily PPO to, or much closer to, its zero line. Also, it's difficult to ignore the failure
When (1) the strongest sectors/areas have significant warning signs, (2) the major indices remain in a downtrend, (3) sustainability ratios remain mostly bearish, and (4) the Volatility Index ($VIX, +8.77%) remains well above 20 and on the rise again, it's no time to be a hero, in my opinion. Please be careful in the short-term. Depending on what happens overnight in Iran, the S&P 500 could literally be anywhere tomorrow morning.
ChartLists and Trading Strategies
I continue to mostly just watch the action. I will have little at risk overnight personally. If we drop further and beneath recent lows, I'll continue to add to my QQQ, SPY, and IWM positions in retirement.
Upcoming Earnings
Our Upcoming Earnings ChartLists and Upcoming Earnings Relative Strength ChartList will be updated and included on our website next week when Q1 earnings reports kick off.
Economic Reports
February durable goods: -1.4% (actual) vs. -1.1% (estimate)
February durable goods ex transports: +0.8% (actual) vs. +0.0% (estimate)
Happy trading!
Tom