
EB Daily Market Report - Wednesday, April 15, 2026
Executive Summary
- Futures were mixed overnight, but U.S. stocks began this morning in positive territory
- The NASDAQ and S&P 500 have shown relative strength throughout the day
- The S&P 500 was trading at 7018 at last check, an all-time record high
- 5 sector are higher today, 4 of which are aggressive sectors, underscoring the strength of this rally
- Consumer discretionary (XLY, +1.54%) is having another solid session, significantly outperforming its staples counterpart (XLP, -0.39%)
- Commodities are relatively flat on the session, with crude oil ($WTIC, -0.20%) falling back to $91 per barrel
- Cryptocurrencies are mostly higher as bitcoin ($BTCUSD, +0.18%) keeps banging up against 75000 resistance; it's looking more and more bullish
- The 10-year treasury yield ($TNX) is up 2 basis points to 4.28%
- Automobiles ($DJUSAU, +6.79%) are helping discretionary stocks as Tesla (TSLA, +7.88%) threatens a breakout above its 50-day SMA on increasing volume
- Netflix (NFLX, +1.05%) reports its quarterly results tomorrow after the closing bell
Market Outlook
Listen, when the S&P 500 was trying to push to all-time highs late in 2025 and during the first two months of 2026, money was rotating defensively.....and I pointed out that this is a problem historically for our major indices. It doesn't guarantee a big selloff, but it is definitely one signal that tells me to be very, very cautious. So that's what we talked about in December 2025 and again at MarketVision 2026 in early January of this year. Check out the chart of the S&P 500 below and how each attempt to move higher from December to February was met with lower sustainability ratios:
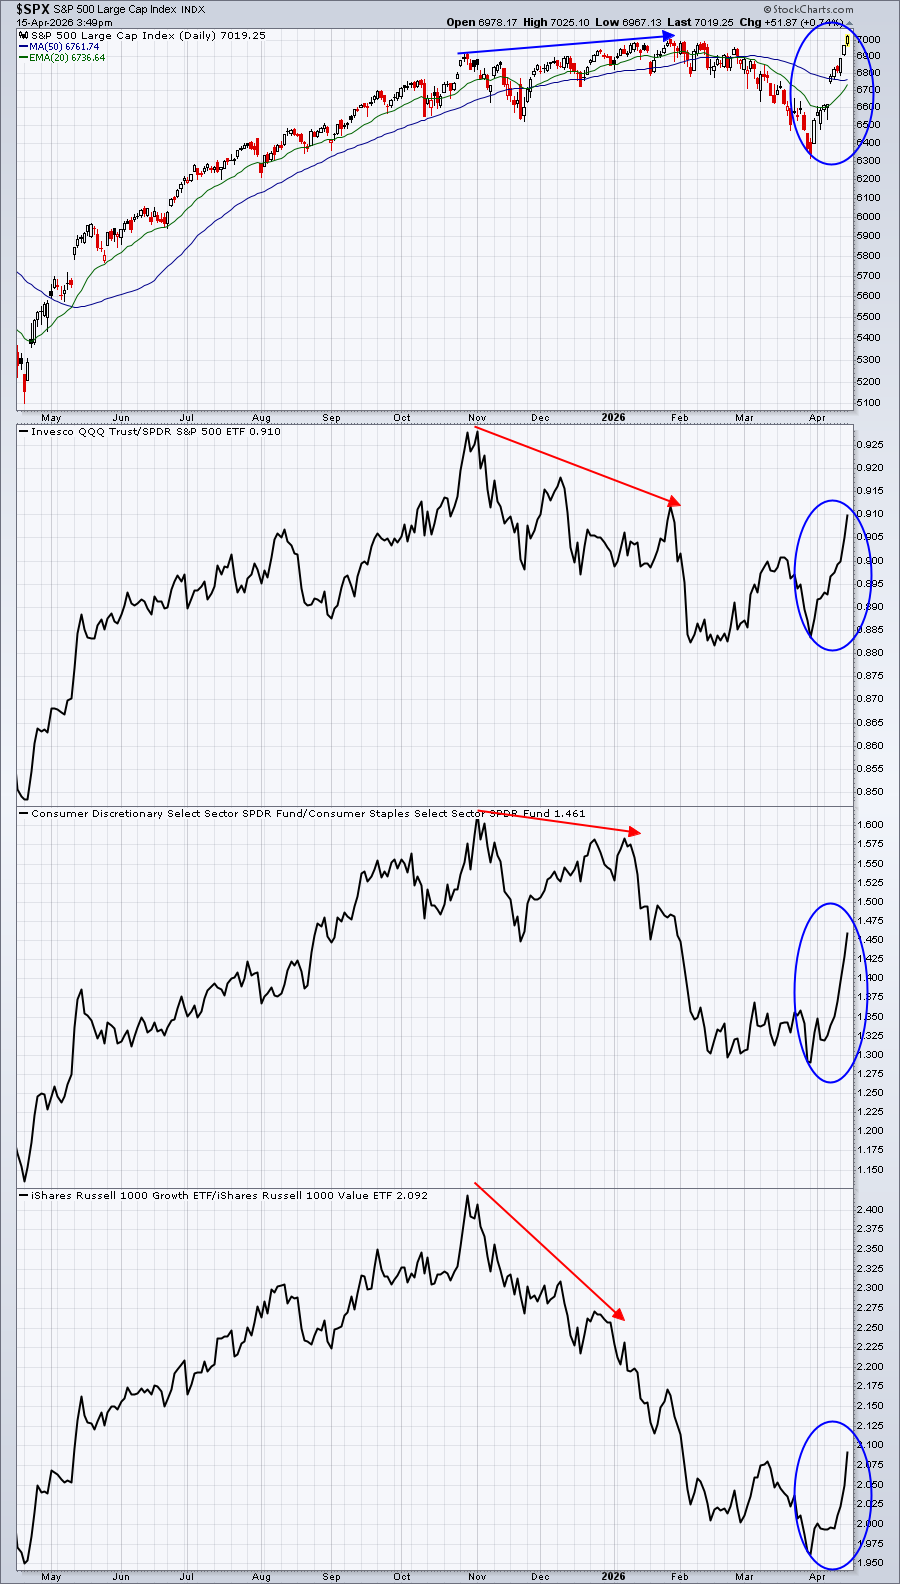
The red directional lines highlight the very weak sustainability ratios while the S&P 500 kept trying to advance. The big Wall Street firms were getting out ahead of the correction that followed. Now we're seeing a significant advance in the S&P and we're clearing all-time high resistance, while these sustainability ratios SOAR. That's the difference between a false rally and a rally you can trust.
We'll have pullbacks along the way, but this action confirms to me that a bottom printed in March. I added more of my retirement funds in stocks today and I'll conclude my buying on the next 20-day EMA test.
Sectors/Industries
It's been a long time since I've said this, but software ($DJUSSW) is HOT. The group reached a very critical support level that was set back in April 2025 during last year's brief cyclical bear market. Here's the long-term chart showing this successful test thus far:
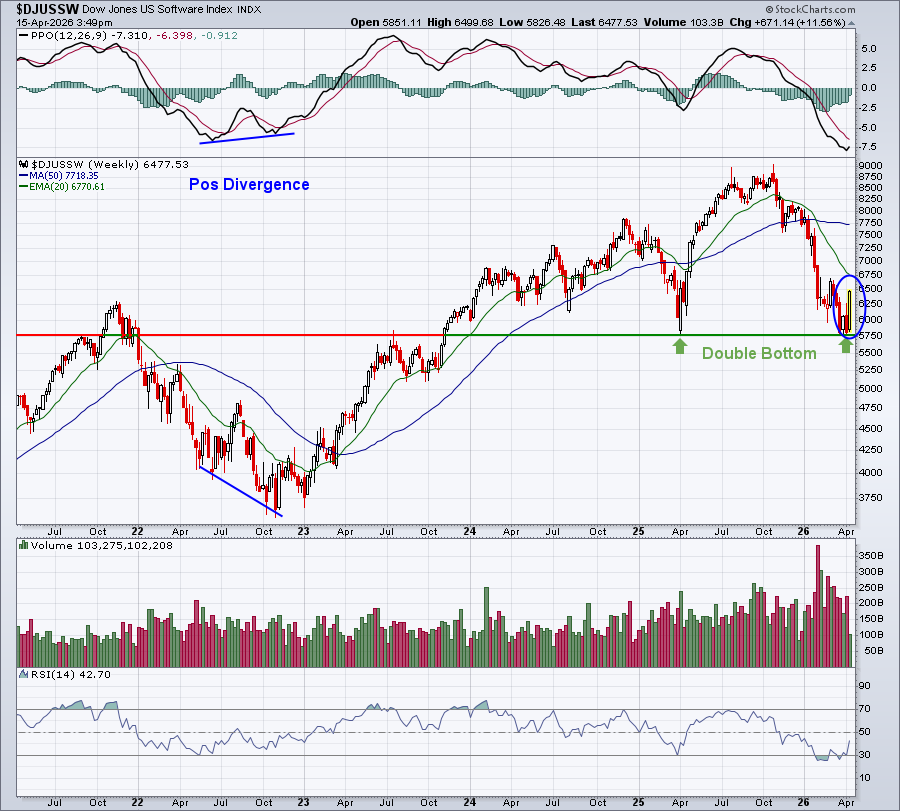
The weakness back during the cyclical bear market of 2022 lasted long enough for a positive divergence to print on the final low. The 2025 and 2026 lows have been "V" shaped bottoms, though we're not out of the woods in 2026.
It is worth noting, however, that the long-term trend in this software chart is UP. The fact that the April 2025 low has held so far is an indication that the long-term uptrend remains perfectly intact, despite the short-term bloodbath experienced since Q3 2025. Here's a look at the shorter-term daily chart:
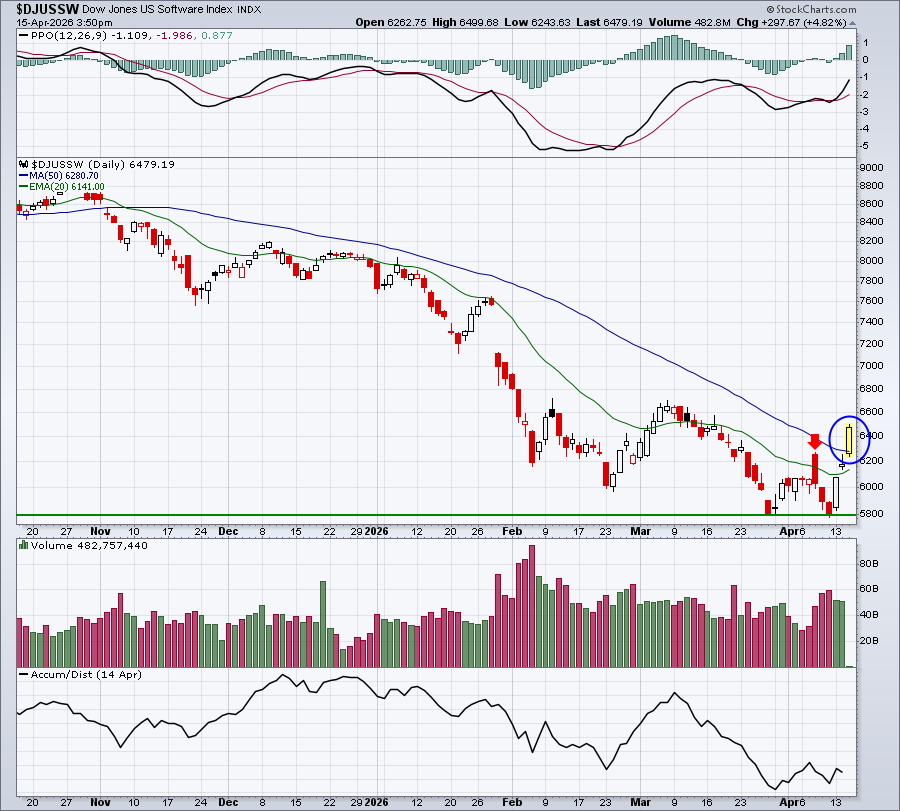
This is a clear breakout above not only the 50-day SMA, but also the high between the double bottom that printed. That latter development is what we see many times to set a significant bottom. I would view software as bullish, until it proves to us otherwise.
ChartLists and Trading Strategies
Many of the software stocks on our ChartLists could be viewed as aggressive momentum trades. Here are three from our Strong Earnings ChartList (SECL) that I like:
GCT:
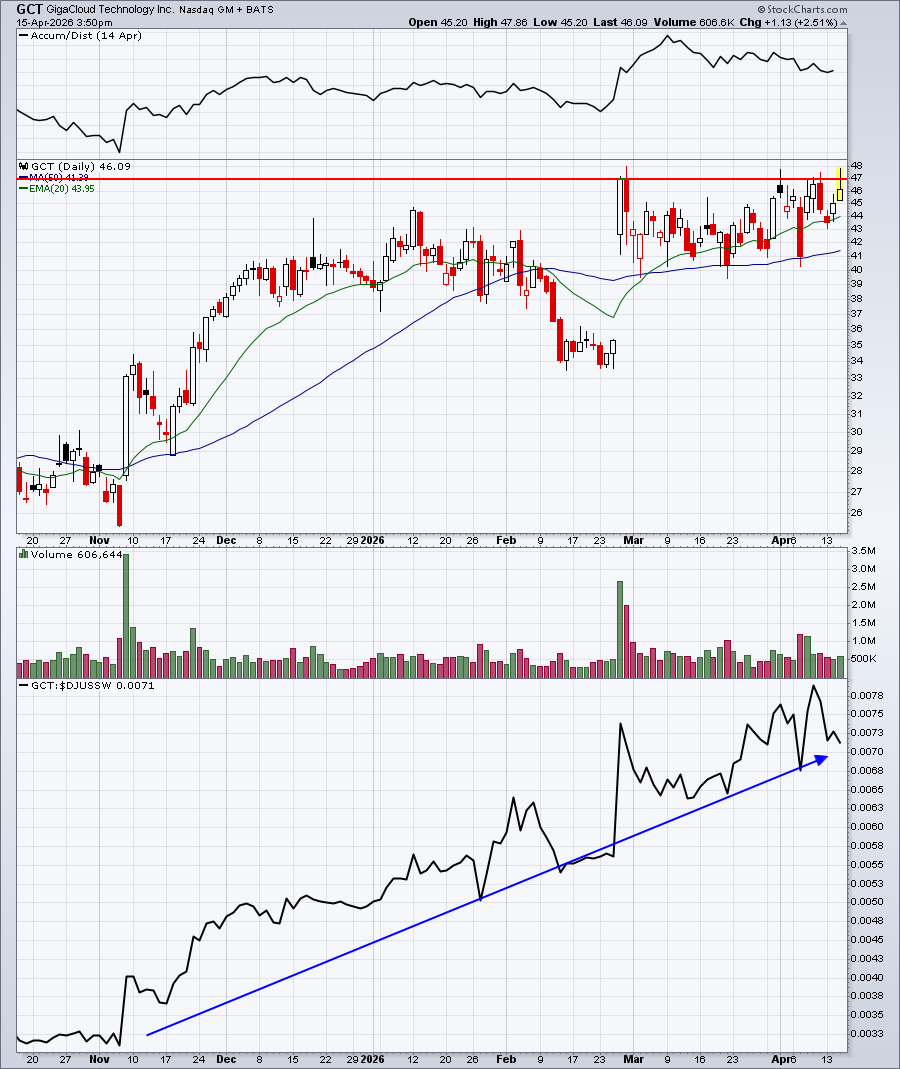
GCT has been a very strong software stock that's been immune to the significant selling over the past several months within the software group. I want to see a breakout here, but it seems like it's just a matter of time.
APP:
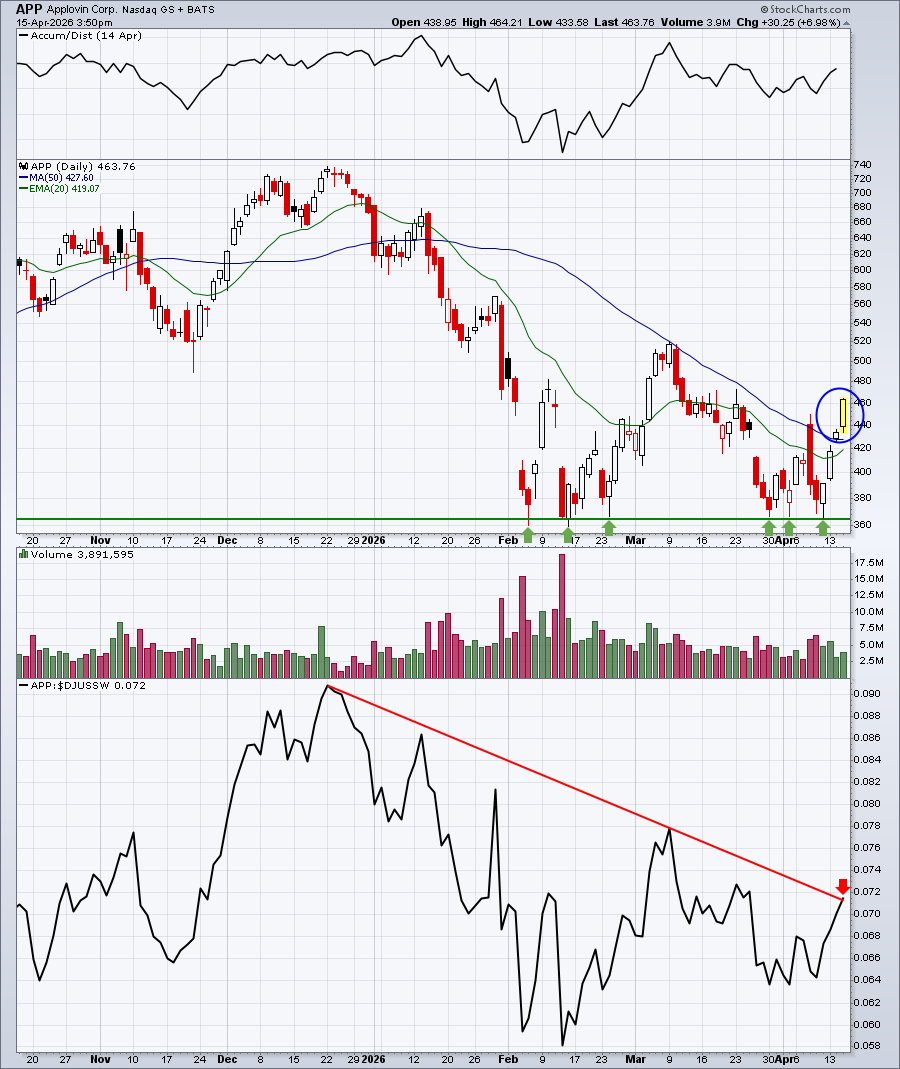
If you follow our Key Manipulation Excel Spreadsheet that we update every weekend, then you know that APP is one of the 20 or so stocks that we've been tracking intraday since the start of 2025. APP has seen a ton of selling over the past few months, but all of it has been in the form of gap downs or very early morning selling, a sign of potential manipulation and Wall Street accumulation. On the heels of this, I expect to see a significant rally in APP and it's recent move back above the 50-day SMA could be just the beginning here.
MSFT:
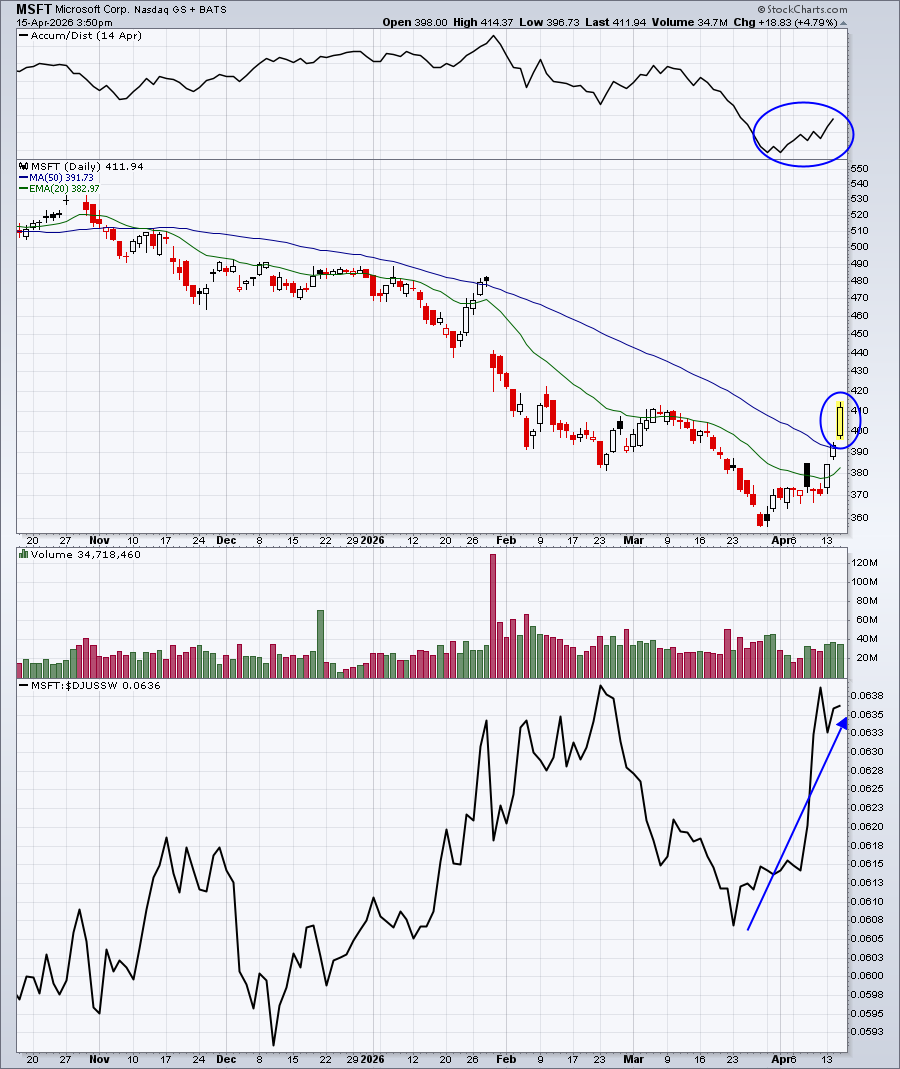
Is there a better name in software? This breakout above the 50-day SMA will likely result in new all-time highs for MSFT at some point later this year or next. Accumulating MSFT now and on any weakness makes a lot of sense to me. I believe the bottom is in here.
Upcoming Earnings
Our Upcoming Earnings ChartLists and Upcoming Earnings Relative Strength ChartList are now on our website as earnings season has kicked off this week.
Economic Reports
April empire state manufacturing survey: 11.0 (actual) vs. -0.5 (estimate)
Happy trading!
Tom