
EB Daily Market Report - Thursday, April 16, 2026
Executive Summary
- Futures were higher overnight and our major indices gapped up slightly
- After an initial move higher, our major indices have mostly traded sideways, digesting gains over the past couple weeks
- Bitcoin ($BTCUSD, -0.62%) remains parked just below key price resistance at 75000
- Commodities are mixed, though crude oil ($WTIC, +3.78%) has rallied back to nearly $95 per barrel
- The 10-year treasury yield ($TNX) is up 3 basis points to 4.31% as the April Philadelphia Fed manufacturing survey came in well ahead of estimates
- Energy (XLE, +1.49%) has moved back to the top of the sector leaderboard, thanks in large part to the rebound in crude prices
- Communication services (XLC, +1.09%) and technology (XLK, +0.96%), two of our key aggressive sectors, are in the 2nd and 3rd spots
- Health care (XLV, -0.76%) and consumer staples (XLP, -0.64%) are lagging
- Mobile Telecom ($DJUSWC, +3.66%) is having a strong day as a smaller company, Bandwidth (BAND, +5.26%) extends yesterday's breakout
- Telecom equipment ($DJUSCT, +2.78%) is strong again; we know about CIEN, LITE, and VIAV, but a stock like Netgear (NTGR, +5.44%) is strengthening as well for those that like smaller stocks
- Netflix (NFLX, +0.46%) reports its quarterly results today after the closing bell
Market Outlook
For our newer members, I want to show you a 10-year chart of the S&P 500, along with the consumer discretionary to consumer staples ratio (XLY:XLP). Those are the top two panels below:
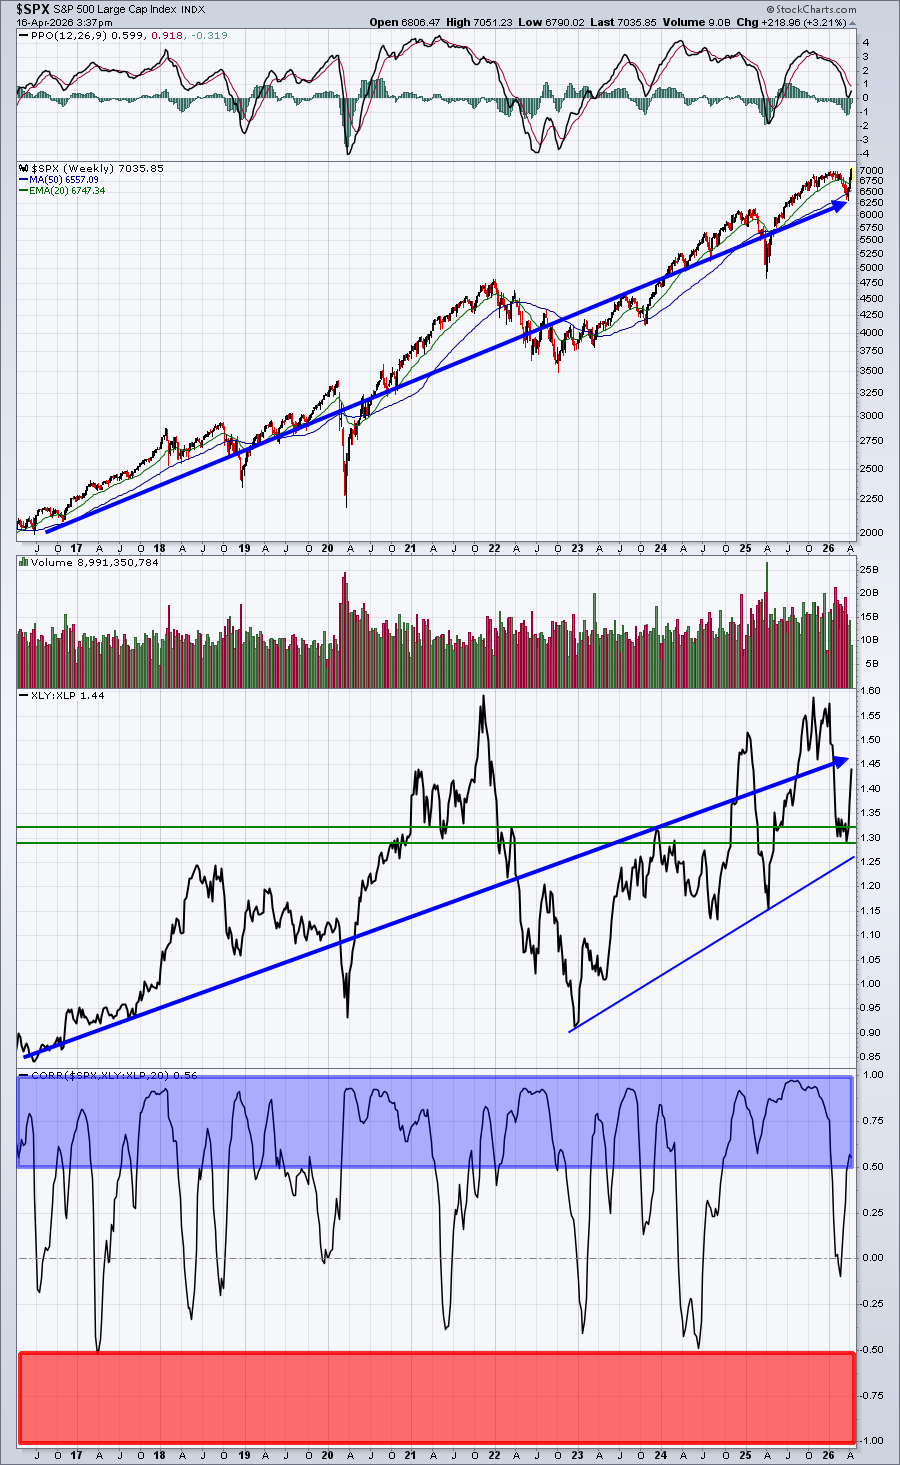
In the bottom panel, you can see the correlation, which tracks the movements of both the S&P 500 and the XLY:XLP ratio to determine if they move together (positively correlated) or apart (negatively, or inversely, correlated). The blue-shaded area represents the former and the red-shaded area represents the latter. Over the past 10 years, we've NEVER seen correlation drop to -0.50 or below. We never touch that red-shaded area. Meanwhile, we spend significant time in that blue-shaded area, evidence that the S&P 500 and the XLY:XLP ratio tend to move in the same direction. This is the reason why it always makes me nervous when the S&P 500 is moving higher, while the XLY:XLP ratio is failing to follow suit. It was one of the big reasons why I felt we could see a 10% correction early in 2026.
Sectors/Industries
One thing I like to see is a healthy banking group ($DJUSBK). So long as banks are doing well, I believe the risks of a recession are quite low. Part of the reason that we're seeing such a strong rally of late, in my opinion, is that banks remain relatively strong and Wall Street believes further rate cuts are coming. In addition to the overall market rising, we're also seeing a stampede back into growth stocks on a relative basis.
Here's how the DJUSBK looks on a 5-year weekly chart:
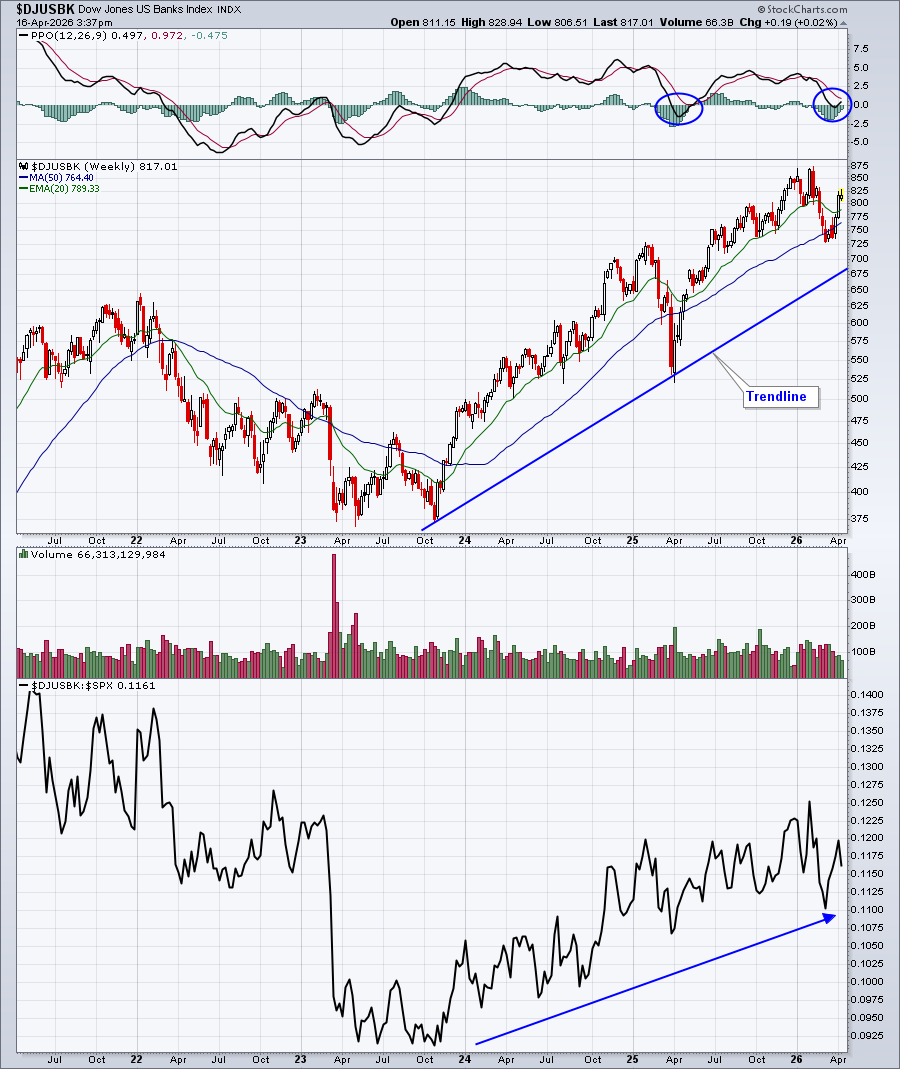
Both the absolute and relative uptrends are intact, suggesting economic health and the ability to skirt any recessionary worries.
ChartLists and Trading Strategies
It's earnings season. Most of you know I love to trade stocks around their earnings. One thing I look for as we approach each day of earnings is I like to look for a company that has been a consistent leader in its space. Generally speaking, these companies post solid numbers that beat Wall Street estimates. If they've pulled back prior to earnings, I expect a strong report and a gap up to challenge recent highs.
To give you an example of an upcoming earnings report that somewhat meets this criteria, check out Chubb Ltd (CB), which reports earnings on the morning of Tuesday, April 21st:
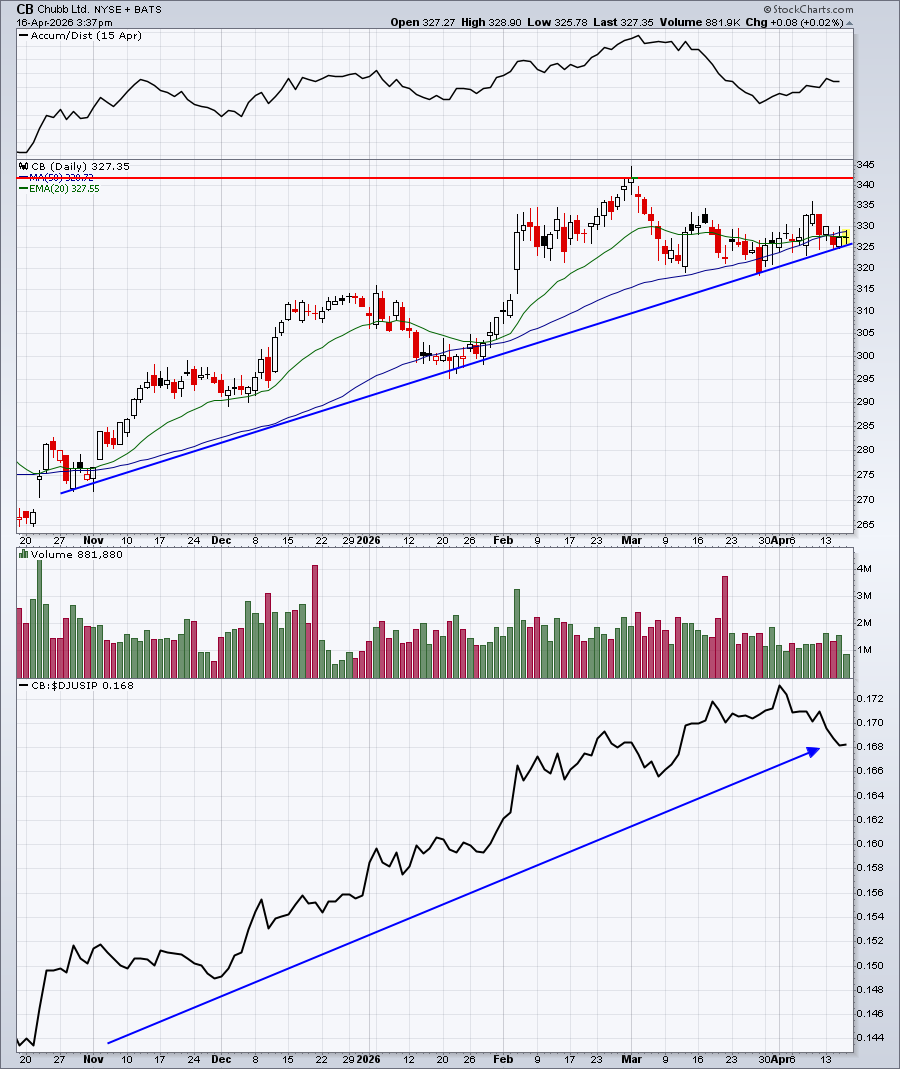
CB has been a leader among its insurance company peers and it's also pulled back within its uptrend. The horizontal line marks the recent high and a potential target after its earnings report is released. Of course, any time you hold a stock into earnings, there's a considerable risk, so please be sure you understand this risk before considering a trade.
Upcoming Earnings
Our Upcoming Earnings ChartLists and Upcoming Earnings Relative Strength ChartList are now on our website as earnings season has kicked off this week.
Economic Reports
Initial jobless claims: 207,000 (actual) vs. 215,000 (estimate)
April Philadelphia Fed manufacturing survey: 26.7 (actual) vs. 12.0 (estimate)
March industrial production: +0.0% (actual) vs. +0.2% (estimate)
March capacity utilization: 76.3% (actual) vs. 76.3% (estimate)
Happy trading!
Tom