
EB Daily Market Report - Thursday, April 30, 2026
Executive Summary
- Futures were higher overnight and our major indices gapped up at the open
- The two-week rally in crude oil ($WTIC, -2.88%) is on pause, though energy shares (XLE, +0.48%) run higher again
- Despite an unexpected big decline in initial jobless claims, the 10-year treasury yield ($TNX) has fallen 3 basis points to 4.39%
- Falling yields have helped to spur small caps (IWM, +1.81%) to outsized gains
- All 11 sectors are higher today, led by value-oriented areas; industrials (XLI, +2.50%) and health care (XLV, +2.12%) lead the way
- Technology (XLK, +0.23%) lags as software ($DJUSSW, -3.19%) tumbles
- Several Mag 7 names reported quarterly results and Alphabet (GOOGL, +10.03%) easily outperformed the others
- Meta Platforms (META, -7.85%) and Microsoft (MSFT, -4.80%) were not treated as kindly, with the latter driving software stocks lower
- Apple, Inc. (AAPL, +1.45%) trades up ahead of its quarterly earnings report today after the closing bell
Market Outlook
4 of the 7 Mag 7 stocks reported their quarterly results yesterday after the closing bell. If I had placed them in order of best relative strength to worst relative strength, I would have done so as follows:
GOOGL
AMZN
MSFT
META
At our Tuesday Q1 Earnings event, I said GOOGL was my favorite of the four, exhibiting excellent relative strength, AMZN was showing improvement, MSFT had broken out to a 52-week high relative to its software peers, but software has been a disaster, and then META, which has been downtrending vs. its internet peers for the past 10 months.
So I'm not at all surprised that GOOGL is up 10% and is the only one of the four in positive territory. The weakness in the other 3 has kept a lid on the NASDAQ 100 today, along, of course, with the 3% drop in software.
Apple (AAPL) reports their quarterly results later today. Again, if we look at relative strength, I believe there could be some disappointment in this report:
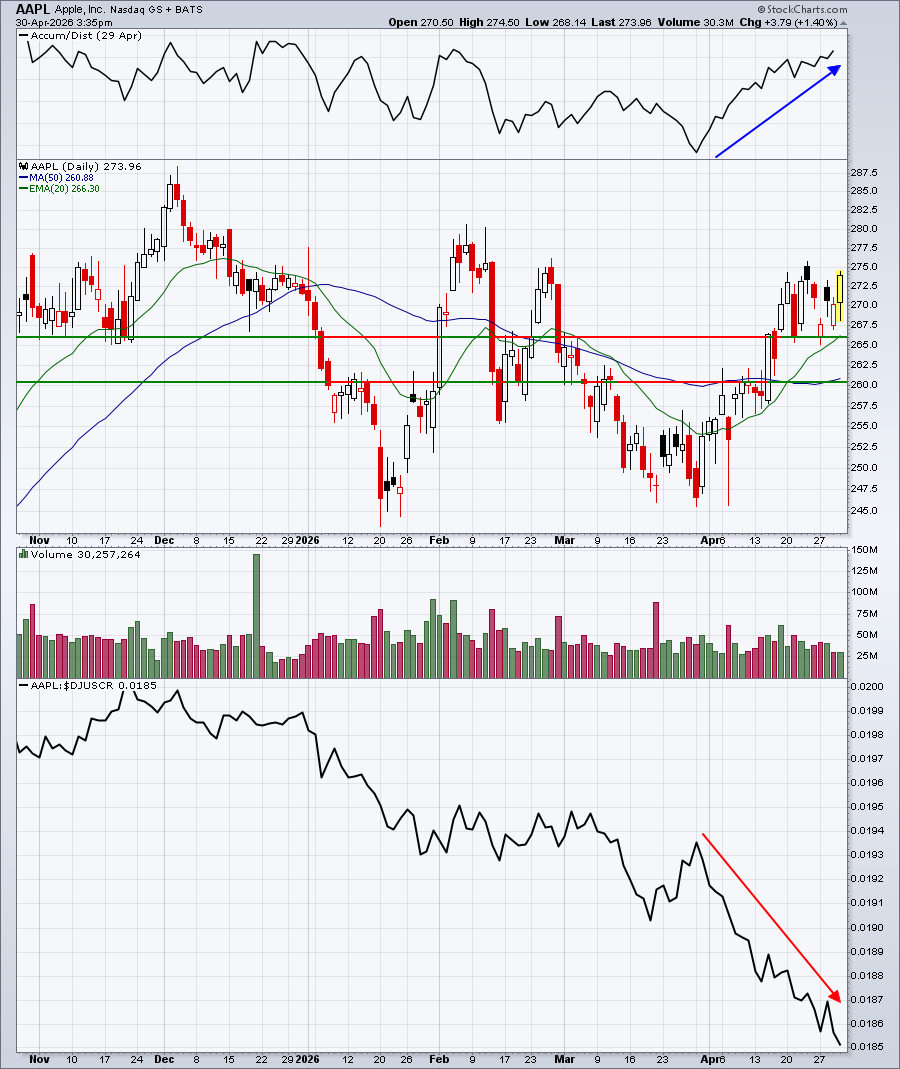
AAPL's relative strength vs. its computer hardware peers ($DJUSCR) has been awful in 2026, actually dating back to just over a year ago. Maybe this earnings report will be a positive surprise and will jumpstart another big upside move. But Wall Street doesn't believe it.
Sectors/Industries
Software ($DJUSSW) remains a big wild card, in my opinion. Some folks believe the days of its leadership have ended. Others, like myself, believe many of the top names will adjust to the AI environment we're in and that the current selling represents a great opportunity. One thing is for sure - the chart doesn't lie. I will stop supporting the "this is a great opportunity" mantra if software begins to falter technically, after its recent advance:
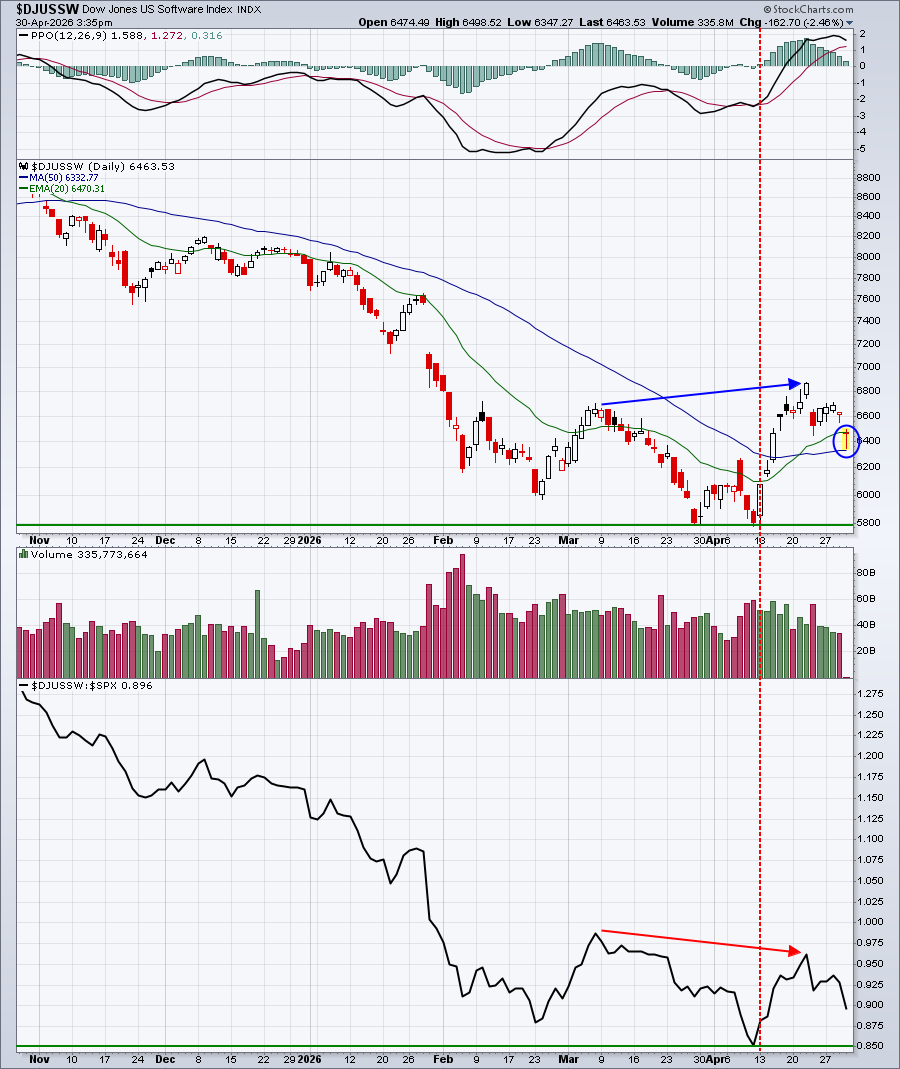
The above chart immediately raises a number of points/questions. First, is a hammer printing today at our key moving averages that will ultimately lead to a rebound in the days ahead? Second, will absolute and relative price support, at the recent lows, hold? Third, should we be concerned that on the recent higher high in absolute price action (blue directional line), there was a corresponding decline in relative price action (red directional line)?
I can tell you that what I REALLY want to see is the $DJUSSW:$SPX relative strength line push above the early-March relative high, establishing a 3-month relative high. That would tell me to perhaps get a little bit more aggressive in this group.
ChartLists and Trading Strategies
Looking back at our Tuesday event and the 17 potential "blowout" quarterly earnings reports that we identified, 5 have now reported. All 5 have delivered results that topped Wall Street consensus estimates as to both revenues and earnings per share. 4 of the 5 gapped considerably higher the next trading day. TTMI and VIAV both gapped up 30% or more. CAT gapped up nearly 10% and FORM gapped higher by 6-7%. Only BFLY had a disappointing market reaction, losing 7-8% on the open. And perhaps it's because BFLY is part of medical equipment ($DJUSAM), which has been one of the weakest industry groups, relative to the S&P 500, over the past year, and especially over the past month.
We still have 12 of those 17 companies setting up for their own quarterly reports and responses. It'll be interesting to see if we can sweep all 17, in terms of identifying companies that beat both top and bottom lines.
Upcoming Earnings
Our Upcoming Earnings ChartLists and Upcoming Earnings Relative Strength ChartList are now on our website as earnings season is well underway.
Economic Reports
Initial jobless claims: 189,000 (actual) vs. 212,000 (estimate)
Q1 GDP: 2.0% (actual) vs. 2.2% (estimate)
March personal income: +0.6% (actual) vs. +0.3% (estimate)
March personal spending: +0.9% (actual) vs. +0.9% (estimate)
March PCE Index: +0.7% (actual) vs. +0.7% (estimate)
March Core PCE Index: +0.3% (actual) vs. +0.3% (estimate)
Happy trading!
Tom