
EB Daily Market Report - Wednesday, May 13, 2026
Executive Summary
- Futures were mixed after a second consecutive inflation report suggested that inflation could be on the rise
- The April PPI came in at a very hot 1.4%, well ahead of estimates, while the Core PPI doubled expectations, +0.6% vs. +0.3%
- The 10-year treasury yield ($TNX) spiked and is currently up 2 basis points to 4.48%, posting a second consecutive 10-month high
- Small caps (IWM, +0.21%), regional banks (KRE, -1.33%), and home construction ($DJUSHB, -1.39%) are performing poorly as rates rise
- Technology (XLK, +1.20%) and communication services (XLC, +0.96%), two key growth sectors, are leading today's bounce-back rally - bullish
- Commodities are mixed today, though crude oil ($WTIC) is slightly lower to $101 per barrel
- Cryptocurrencies are weak, but bitcoin ($BTCUSD, -1.59%) remains well above its key price support of 74000-75000
- Ford (F, +16.06%) is surging after Morgan Stanley suggested its energy storage business is a $10 billion opportunity
- Cisco Systems (CSCO, +1.89%) reports its latest quarterly results after the bell today; I'm expecting a very strong report given CSCO's huge rally pre-earnings
Market Outlook
The April CPI and PPI reports have been released the past two days and, quite honestly, they're the most inflationary reports we've seen in some time. In a more volatile market environment like the one we just had in February and March, I believe the S&P 500 could have seen a gap down of 100 points or more. Instead, we've barely seen the market yawn.
The Volatility Index ($VIX), a key market maker sentiment metric, is literally DOWN from where it was two days ago, after ridiculously-high inflation levels that easily surpassed Wall Street consensus estimates. What this tells me is that, while media outlets are posting all these negative headlines and how the Fed may have to raise interest rates, big Wall Street money just keeps pouring into high growth areas of the market - even during an option-expiration week where I'd expect to see selling in growth areas.
Personally, I just don't argue with the charts and the story they're telling. Right now, it's a growth story, so that means IGNORE the inflation headlines - at least for now.
Sectors/Industries
Leadership today is in autos ($DJUSAU), internet ($DJUSNS), renewable energy ($DWCREE), and semiconductors ($DJUSSC), all growth areas that have been performing very well of late. Despite max pain reasons AND inflationary reasons for potential declines, these groups continue to perform very, very well. Wall Street is looking past max pain and any short-term inflation issues and focusing squarely on what lies ahead - strong earnings and a very low interest rate environment, at least based on historical standards.
Broadline retail ($DJUSRB) is showing a bit of leadership today and this is a group that's improved tremendously over the past few months. Check out the DJUSRB chart, relative to the S&P 500. In the bottom panel, you can see the absolute breakout that took place as April kicked off:
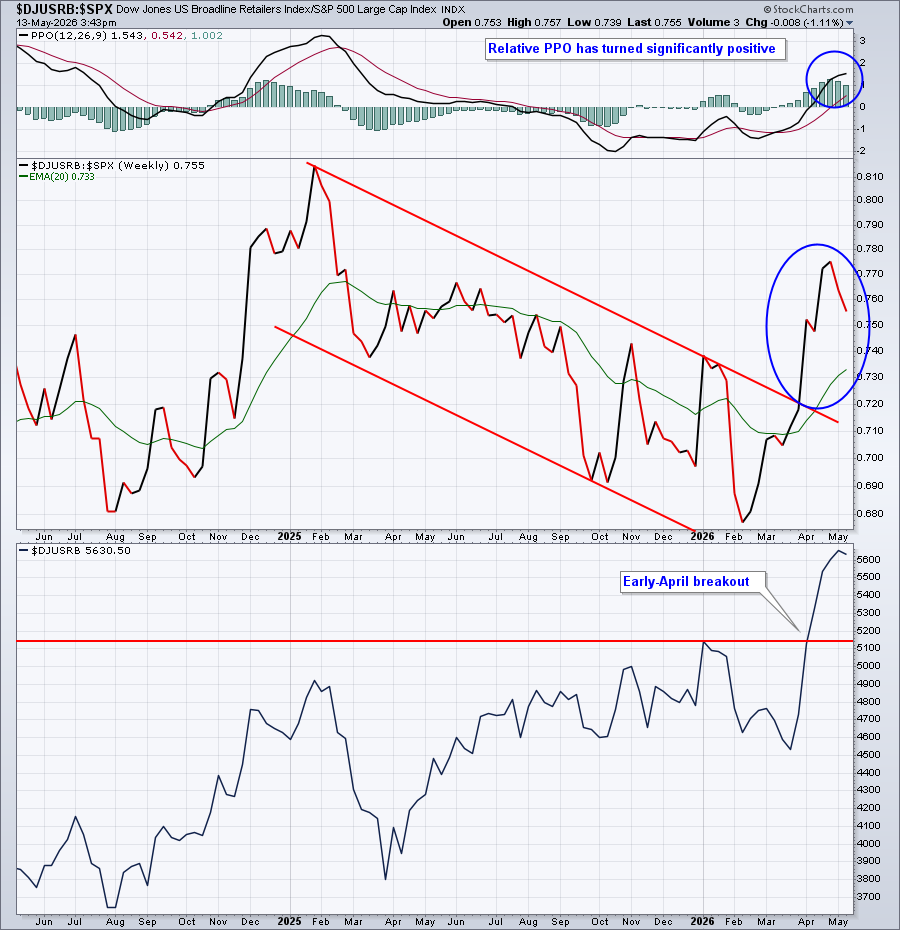
Given this breakout and Amazon.com's (AMZN) improving relative strength vs. its broadline retail peers over the past 3 months, I'd look for AMZN to continue to outperform the benchmark S&P 500.
ChartLists and Trading Strategies
Nextpower, Inc. (NXT, +13.42%), a renewable energy company ($DWCREE), was mentioned yesterday, indicating that a bullish ascending triangle pattern was in play as the market awaited its latest quarterly earnings results. NXT beat Wall Street estimates on both revenues and earnings and the stock is the best performer on our Raised Guidance ChartList (RGCL) today. Its pattern measurement is roughly 160, so I do see more upside ahead for NXT. Watch 130 price support and the rising 20-day EMA as best entry opportunities on any significant weakness.
Upcoming Earnings
Our Upcoming Earnings ChartLists and Upcoming Earnings Relative Strength ChartList are now on our website as earnings season begins winding down.
Economic Reports
April PPI: +1.4% (actual) vs. +0.5% (estimate)
April Core PPI: +0.6% (actual) vs. +0.3% (estimate)
Happy trading!
Tom