
EB Daily Market Report - Thursday, May 21, 2026
Special Note
John Hopkins and I will be hosting our latest Happy Hour right after the market closes tomorrow, Friday, May 22nd, at 4:05pm ET. You can tune in live on YouTube.
This is not intended to be a stock market discussion, though we may talk a bit about it. Instead, we'll just be shooting the breeze and we'd certainly welcome any and all of you to join us. So grab your favorite Friday afternoon cocktail and we'll see you at Happy Hour!
Tom and John
Executive Summary
- Futures were weak overnight and our major indices struggled during the morning session
- Stock prices have risen since, however, as oil has fallen back considerably over the past couple hours
- As a result, energy (XLE, -1.47%) is one of just two sectors losing ground today; consumer staples (XLP, -0.96%) is also under pressure
- Meanwhile, materials (XLB, +1.06%) and consumer discretionary (XLY, +1.02%) are leading the way
- Clothing & accessories ($DJUSCF, +5.01%) is rolling as Polo Ralph Lauren (RL, +15.11%) surges following a very strong quarterly earnings report
- Stocks also surged into positive territory about the same time that the 10-year treasury yield ($TNX) dropped from 4.60% to 4.56%
- International Business Machines (IBM, +11.76%) and Lumentum (LITE, +11.00%) are also strong and trailing RL, the top-performing S&P 500 stock
- NVIDIA Corp (NVDA, -1.40%) is down slightly after posting strong results
Market Outlook
The Dow Jones appears to be back on track to make its measurement to 53,000 based upon its breakout from a bullish inverse head & shoulders breakout pattern from August:
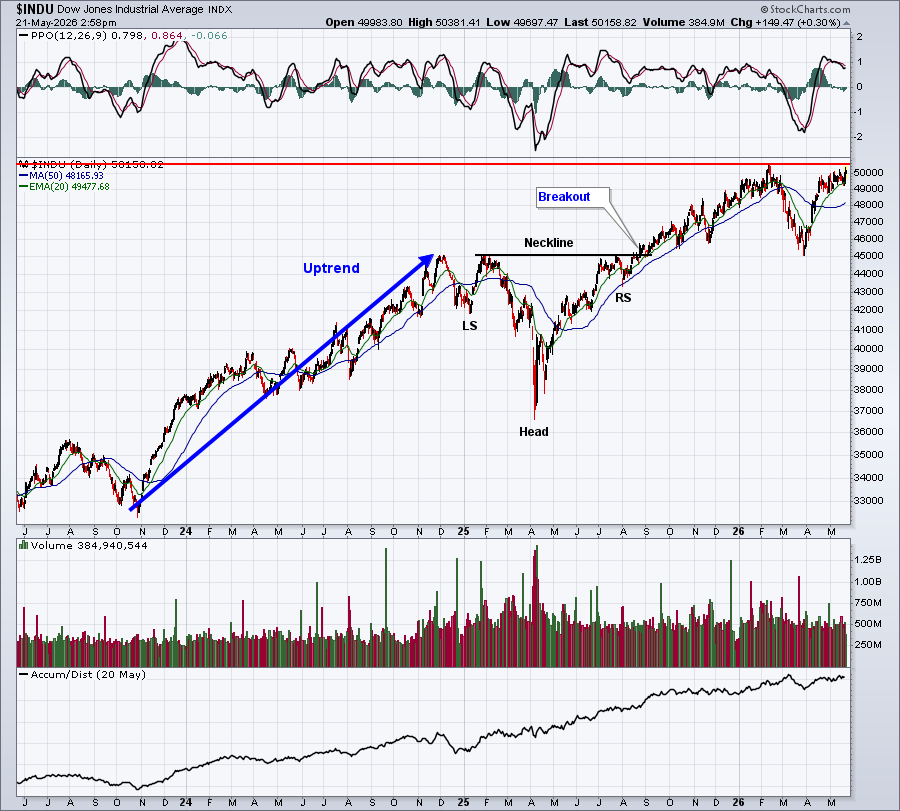
The Dow's all-time INTRADAY high is 50,512.79, so the Dow still has a bit of work to do to clear that. However, the Dow's all-time high close was on the same day (February 10th) at 50,188.14. Right now, the Dow is trading at what would be a new all-time high close.
The bottom line? The Dow Jones is trying to join both the S&P 500 and NASDAQ 100 in all-time high territory. The small cap Russell 2000 (IWM) still has some more work to do.
Sectors/Industries
I spend a lot of time following momentum and relative strength, because I believe, as a trader, I have a much better chance outperforming the S&P 500 than by trying to time bottoms in underperforming stocks. I do, occasionally, however, look for returning strength in long-term winners - like I've been discussing recently with software ($DJUSSW).
Renewable energy ($DWCREE) is another. This group, many times, will move at the speed of light for a relatively brief period, so you've got to be willing to take risks in order to catch the ride higher. Here's a long-term chart of the DWCREE that shows the massive moves that can occur quickly:
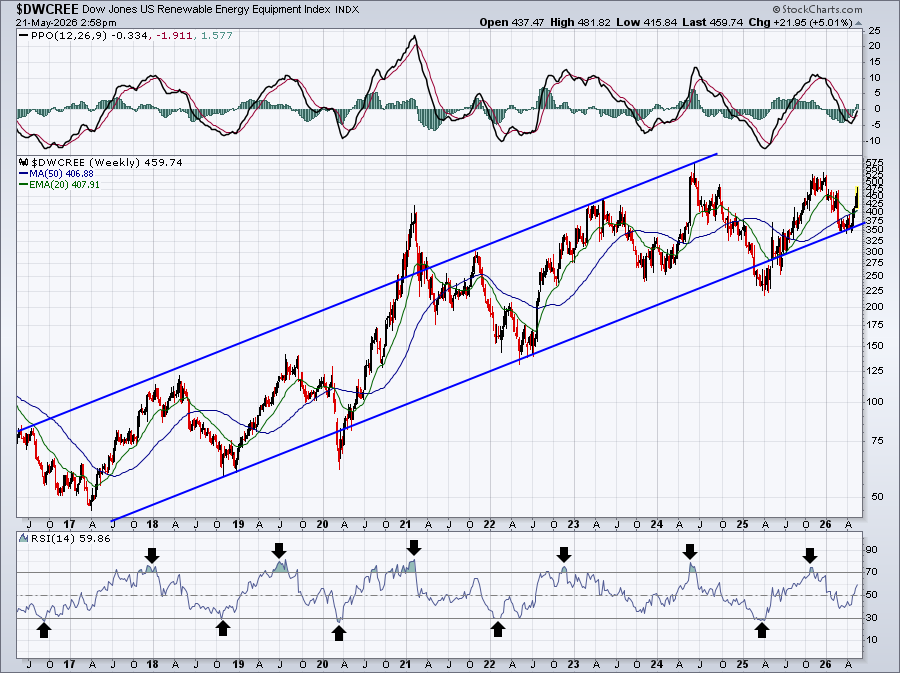
Most consistent uptrends see the weekly RSI move above 70 frequently, as it does here. However, RSI 40 usually provides support, but you can see with the DWCREE, that it totally falls out of favor, before rushing up to new highs again. It's a very difficult group to trade, because of this. The good news, though, is that when this group moves, IT REALLY MOVES! So a very good question right now is.....do you want to take the risk that we've started a major move to the upside. If you're right, it'll be extremely rewarding. But you also have to be willing to get it wrong and suffer the consequences. Renewable energy is mostly for those willing to accept a very high level of risk.
ChartLists and Trading Strategies
Let me take a moment to discuss our Short Squeeze ChartList (SSCL). First of all, I rarely trade off of it. Most of the stocks on this ChartList are on there for a reason. Big money is betting against them and most of them simply continue to spiral lower and lower. I would NEVER buy an SSCL stock, just because there are a lot of short sellers. Yes, they do represent guaranteed buyers, but they will not cover unless (1) they make big money, or (2) they are forced to do so out of panic. The only way they experience panic is if a short squeeze stock begins to move significantly higher and most, if not all, of those shorting begin to lose money rapidly.
Also, a short squeeze is NOT occurring unless you're seeing a HUGE move to the upside and MASSIVE volume accompany that move. Short squeezes do not occur on light volume. Heavy volume = panic.
As a rule of thumb, I generally won't consider a short squeeze stock for purchase unless (1) it is moving up to clear major price resistance hurdles, (2) shows a strong AD line or a rapidly-improving AD line, (3) shows extremely heavy volume waaaay above average, and (4) exhibits relative strength among its peers. Even with all of this present, you still must be very nimble and disciplined. If I'm fortunate enough to gain a quick paper profit, I usually look to capture at least partial profits and put a stop loss in place to ensure that I don't turn the profitable trade into a losing one. These stocks can be quite volatile, which means you have to be willing to get whipsawed out of your position occasionally.
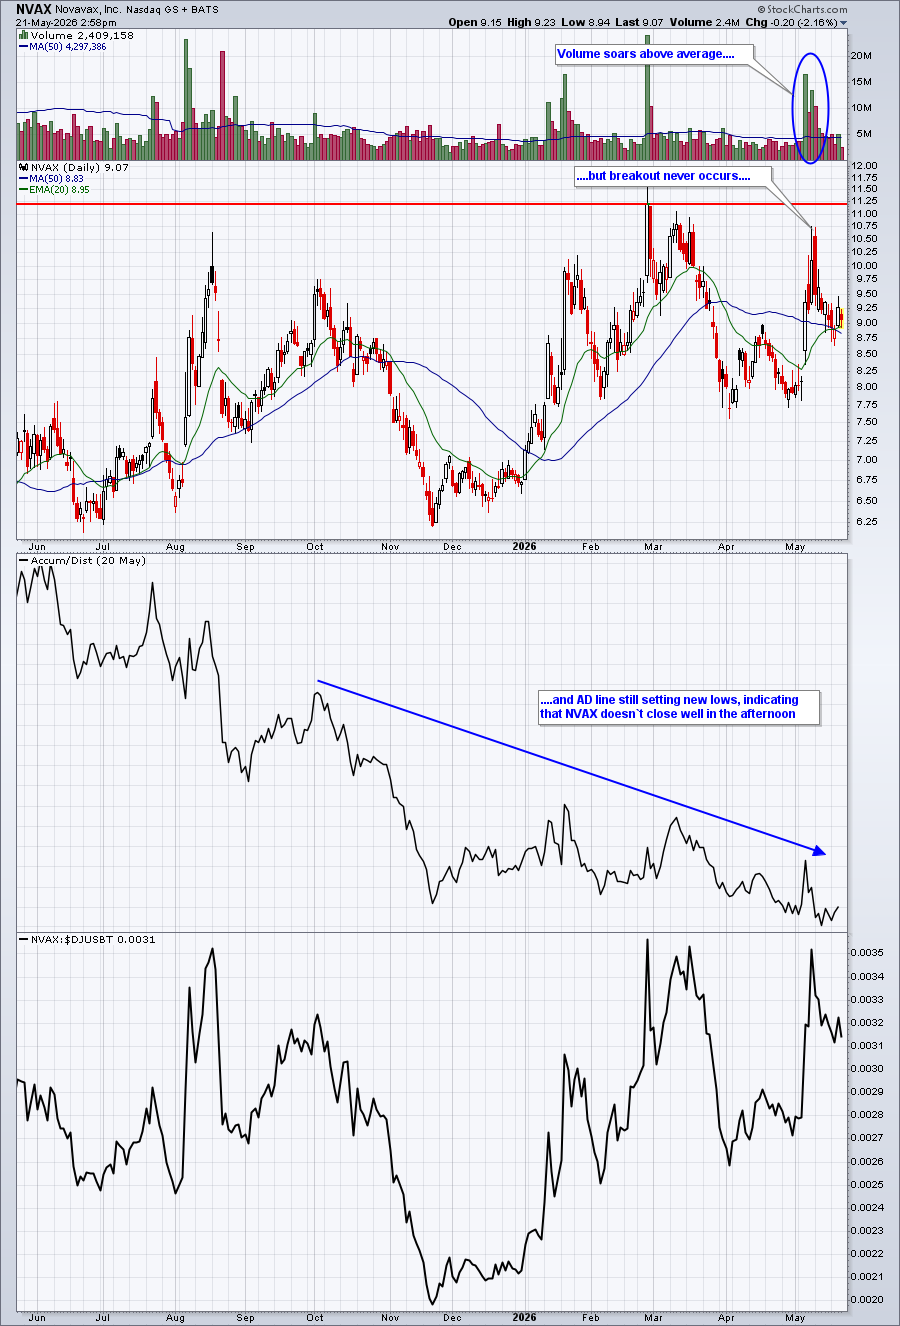
On the SSCL, Novavax, Inc. (NVAX) is "034 - NVAX - 28.28%". The 28.28% refers to the Short Percentage of Float. Float is the number of shares available to trade. The higher this percentage is, the larger the buying stampede if a short squeeze were to happen. Recently, NVAX made a push higher and nearly reached a 52-week high. The volume expanded considerably on the move, but the breakout was never made AND the AD line continues to spiral lower. I don't like a setup like this:
I would consider this short squeeze trade if:
- NVAX breaks out above 11.25
- Volume soars to 10-15 million, or even much higher
- I see a relative strength breakout (bottom panel)
- and the AD line starts to improve
I don't try to find reasons to buy short squeeze stocks. They should find me.
Upcoming Earnings
Our Upcoming Earnings ChartLists and Upcoming Earnings Relative Strength ChartList are still included on our website, but earnings season is winding down. We'll provide these ChartLists for the next couple weeks, then we'll pause until Q2 earnings season begins in mid July.
Economic Reports
Initial jobless claims: 209,000 (actual) vs. 212,000 (estimate)
April housing starts: 1,470,000 (actual) vs. 1,420,000 (estimate)
April building permits: 1,440,000 (actual) vs. 1,390,000 (estimate)
May Philadelphia Fed manufacturing survey: -0.4 (actual) vs. 19.0 (estimate)
Happy trading!
Tom