
EB Daily Market Report - Tuesday, June 2, 2026
Executive Summary
- Futures were a bit lower overnight and we did see an initial gap down
- We've since strengthened, with relative outperformance by small caps (IWM, +0.78%)
- Cryptocurrencies are much lower as bitcoin ($BTCUSD, -6.00%) drops back close to 67000; the loss of 74000-75000 support has led to more selling
- The 10-year treasury yield ($TNX) is down 2 basis points, continuing to drift lower
- Energy (XLE, +1.34%) trails only utilities (XLU, +1.93%) as crude oil ($WTIC, +1.86%) jumps back to nearly $94 per barrel
- 4 sectors are lower, led by communication services (XLC, -1.68%)
- Internet stocks ($DJUSNS, -2.14%) are weak as Alphabet (GOOGL, -3.12%) drops and tests gap support - more on this below
- Semiconductors ($DJUSSC, +1.29%) are moving higher and setting new records, though profit taking in software ($DJUSSW, -3.28%) is keeping the NASDAQ bulls at bay
- Palo Alto Networks (PANW, -2.02%) has doubled in the past two months and will be reporting its quarterly results after the bell today
Market Outlook
On my Trading Places Live show this morning, I summarized U.S. stock gains since April 10, 2013, the day in which the S&P 500 soared to close above its double top from years 2000 and 2007. The numbers are startling and underscores how diversification limits gains. From April 10, 2013 through June 1, 2026, here is a chart of the S&P 500, along with the cumulative gains in the major indices, sectors, and key industry groups:
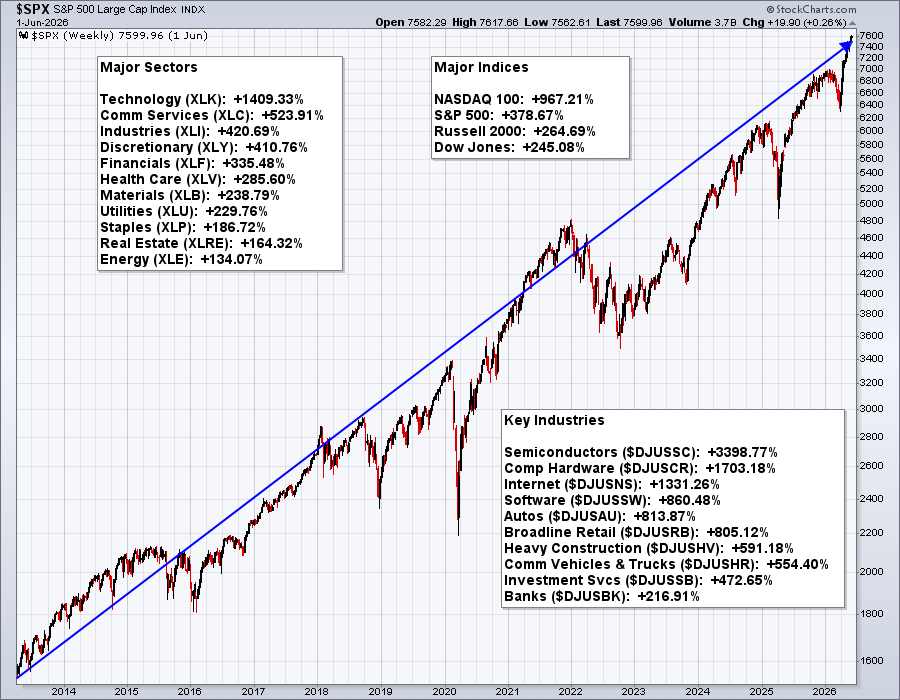
Check out the gains in those aggressive industry groups. We've seen a gain of nearly 3400% in semiconductors since April 2013. That's only 13 years, not exactly a lifetime of investing. Semiconductors only had about 3-4% representation in the S&P 500 in April 2013, but that weighting has now grown to roughly 17% of the index.
Growth during secular bull markets is what carries the S&P 500 higher. That's why I constantly discuss the large cap growth (IWF) and large cap value (IWD) relationship. It's why I use my sustainability ratios. Growth drives U.S. equities higher.
Diversification seems smart and it definitely is if your time frame is relatively short. However, the further out your financial goals are, the higher risk that you should take in your investing in order to maximize your opportunity.
Sectors/Industries
Internet stocks ($DJUSNS) have obviously been a big part of the secular bull market advance, as evidenced on the chart above. This is an area that should always be considered, especially when it hits key support like it's doing today:
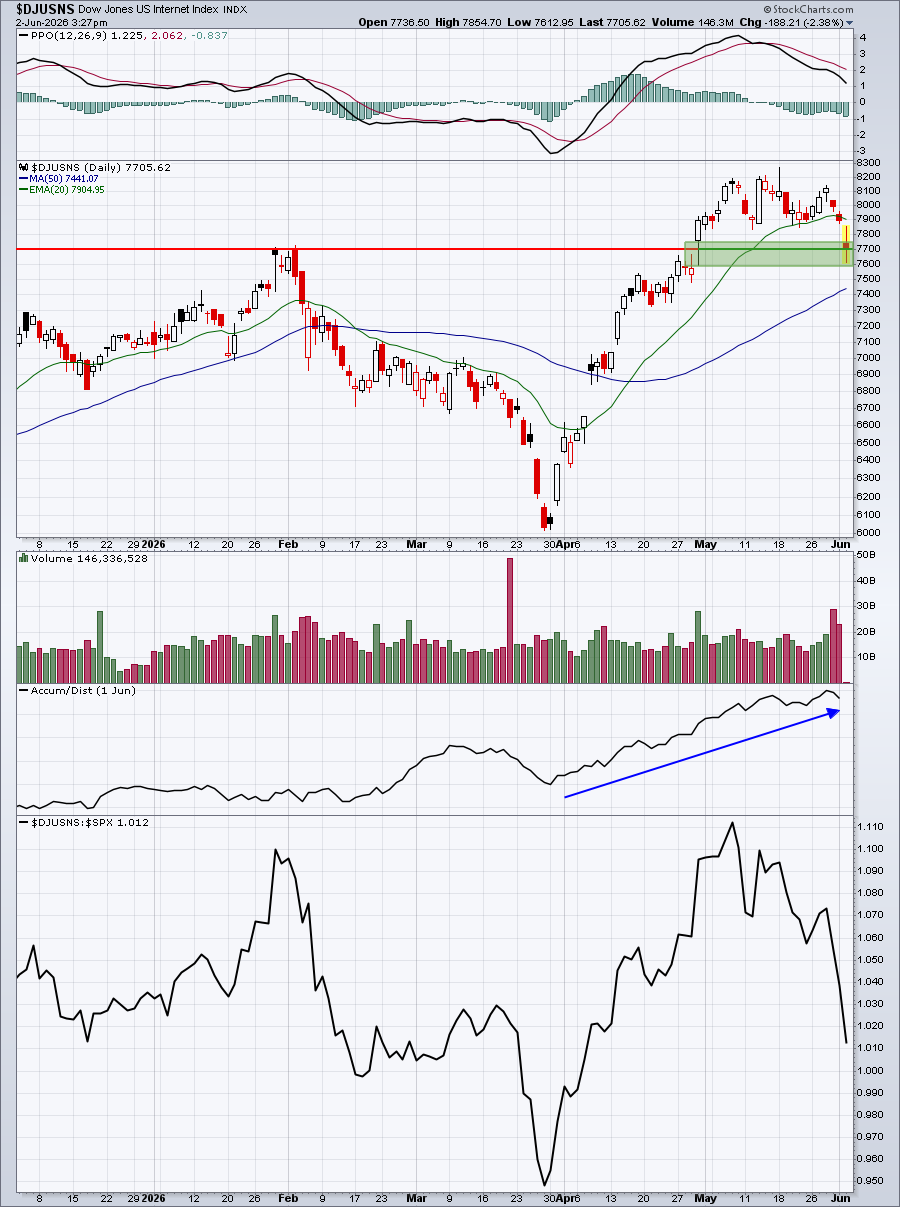
There's no guarantee that the pullback stops here, but there are reasons for traders to be buying into one of the most influential industry groups. We're in the midst of key gap support, top and bottom, while also testing the price level of the last breakout. While it doesn't appear on this chart, the daily RSI has moved into the 40-50 range, where uptrends generally find support as well.
ChartLists and Trading Strategies
Let's check out potential internet trades, given the recent selling in the group. I could look into our ChartLists for specific internet trades, but for this exercise, I'm going to pull up ALL internet stocks using the StockCharts scan engine and rank them in SCTR order to highlight the best relative performers. From there, I'll see if any individual stocks are testing key support levels.
Here's the very simple scan that I ran:

And the results....
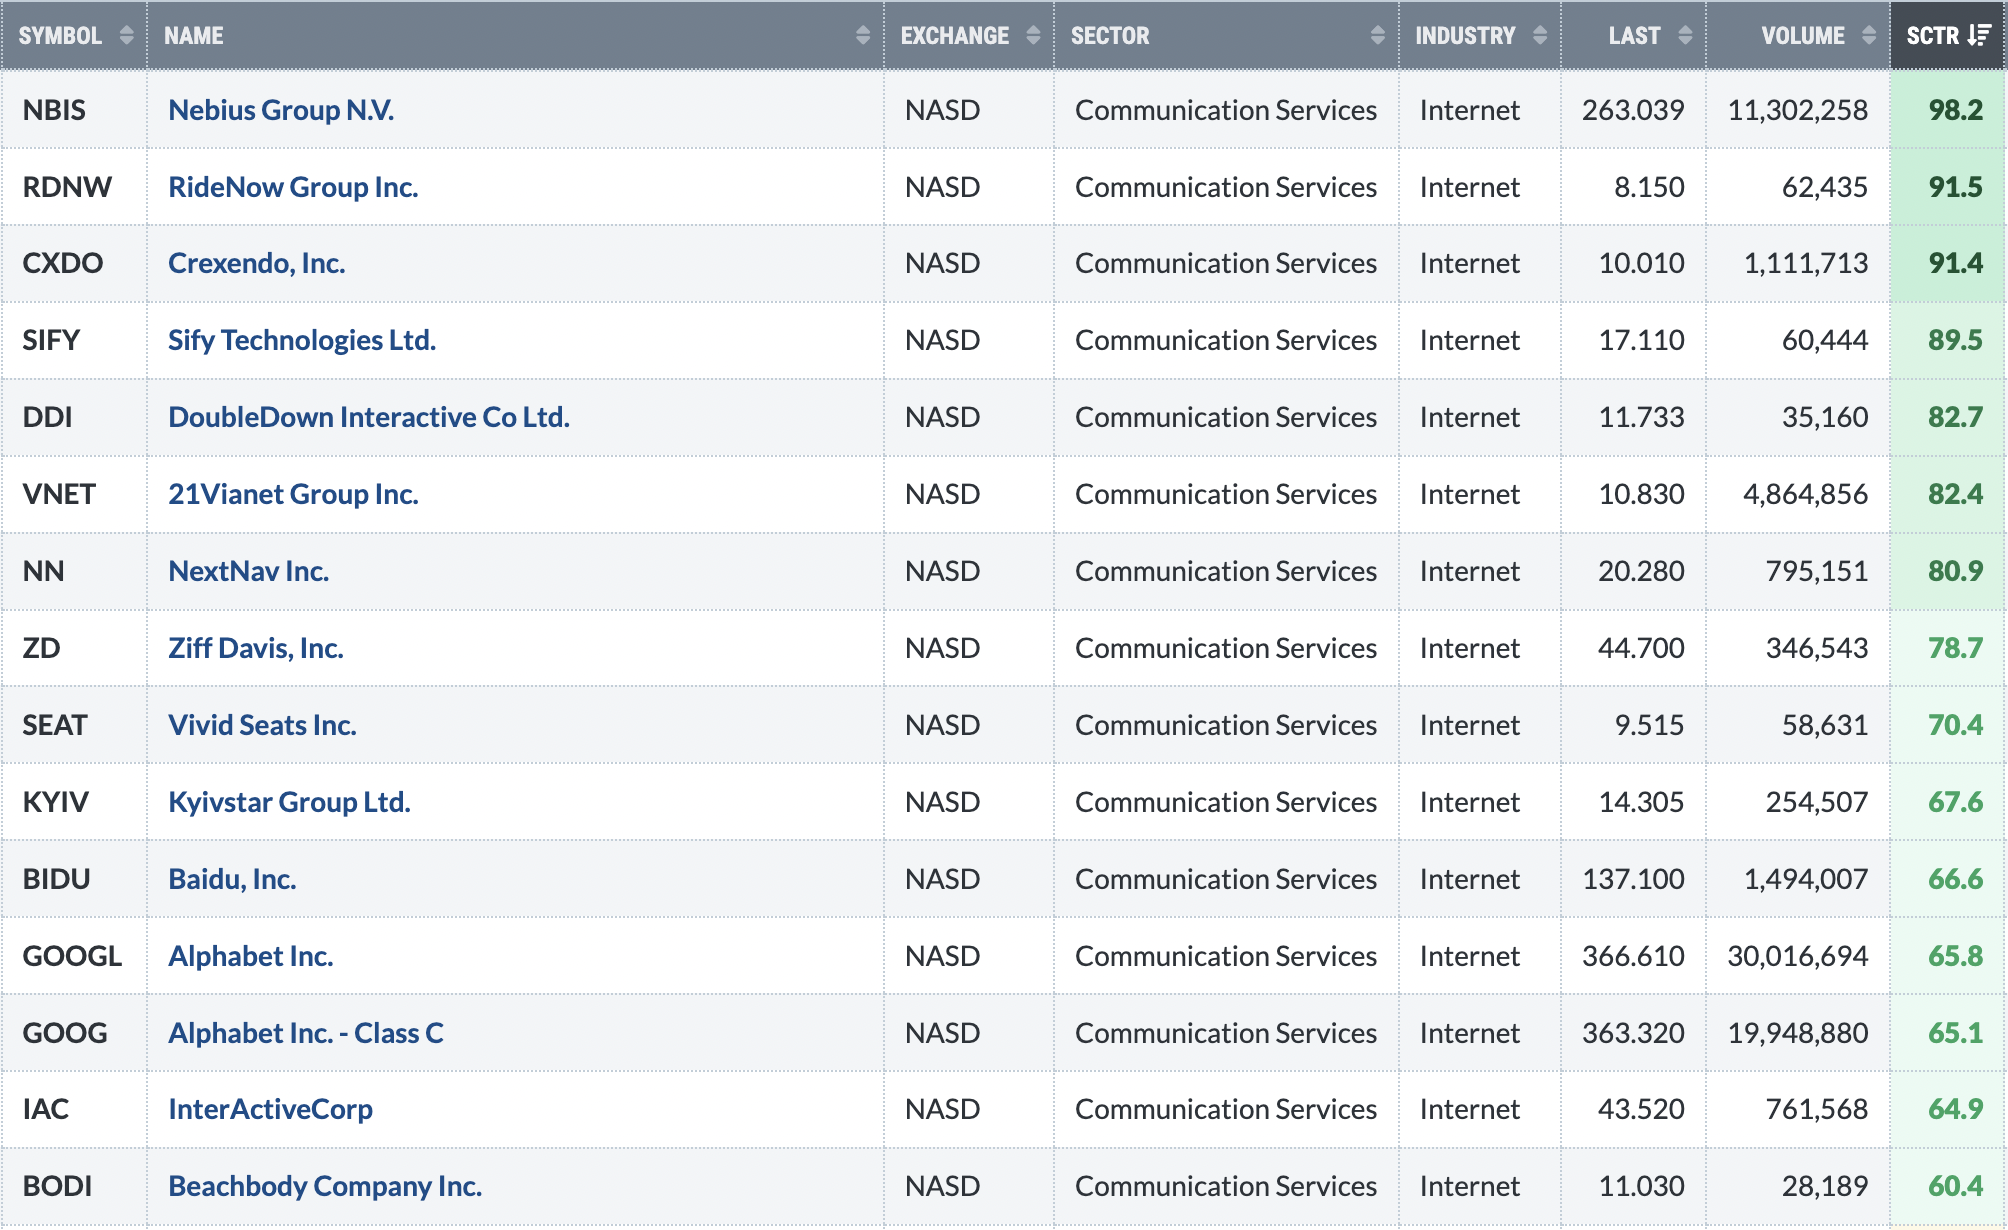
Here were 4 I thought were worth mentioning:
DDI
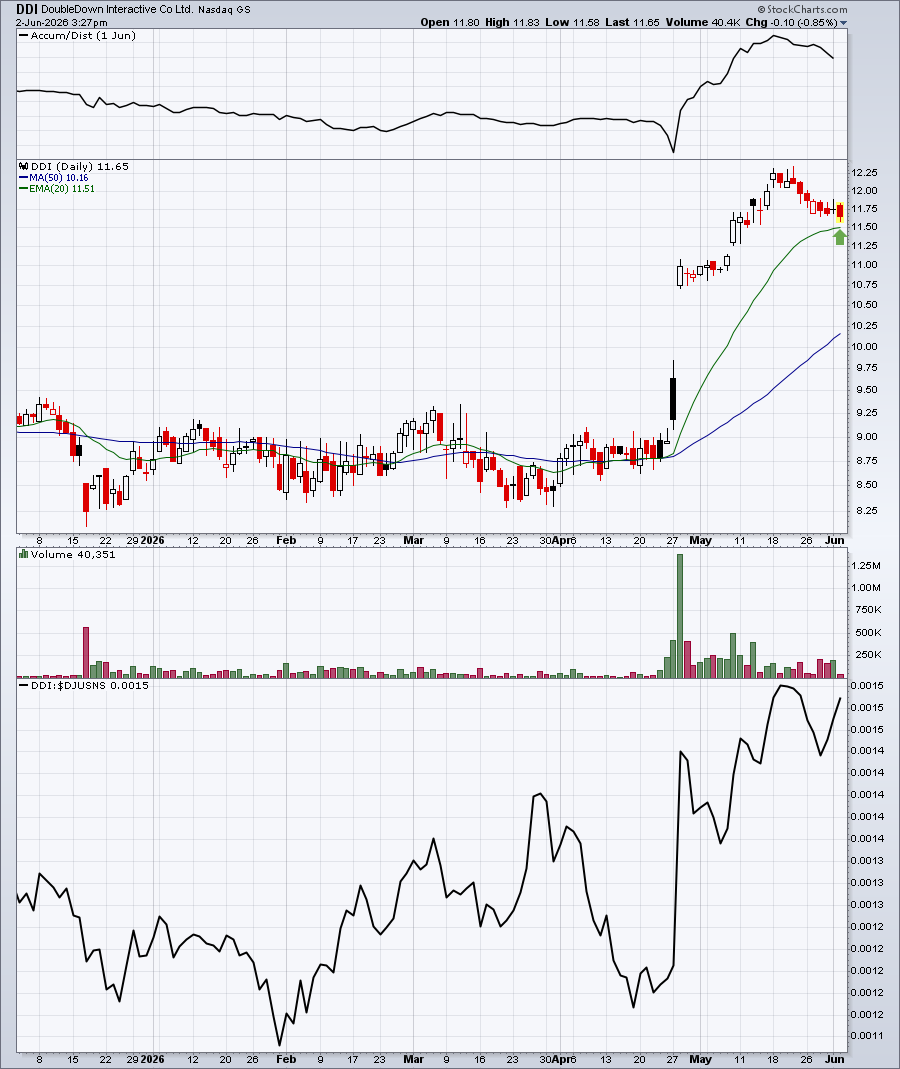
The volume on this one can be very light sometimes, so that might keep me from buying. However, the rising 20-day EMA test would be an interesting entry level, with the recent high of 12.25 the initial target.
NN
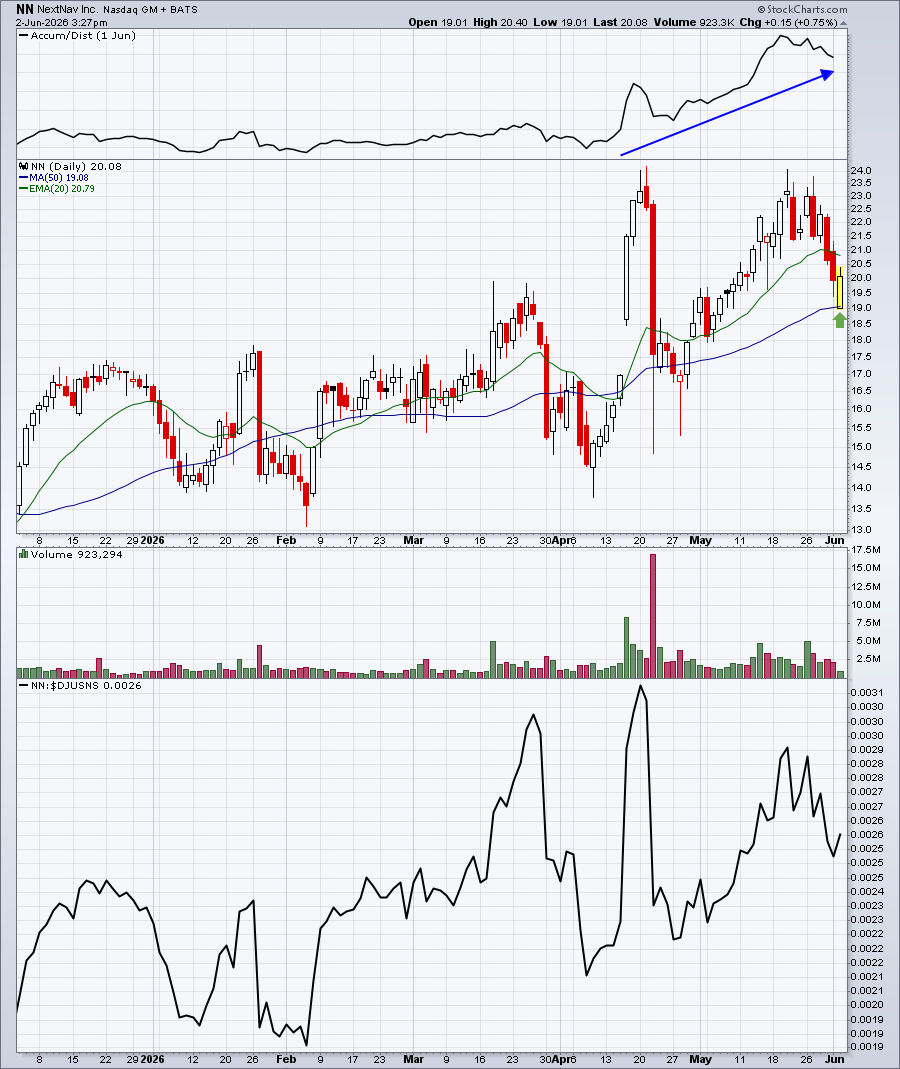
You might need an Alka-Seltzer with NN. The volatility has been high, but I do like the solid AD line and today's test of and bounce off of the 50-day SMA.
GOOGL
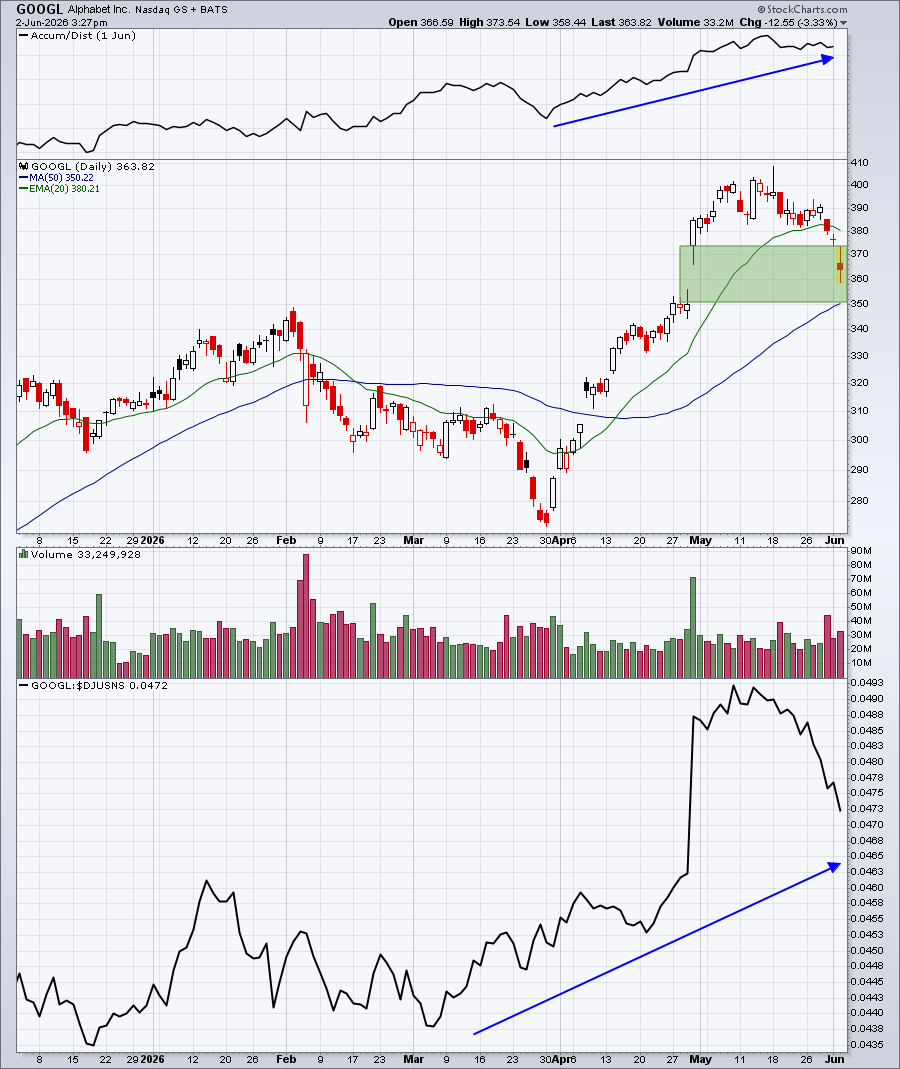
This is the stock that's driving the internet index. You can see that the charts are quite similar. Nonetheless, today's drop into gap support likely represents a solid opportunity for a short-term trade. The best entry is 350, should it get there.
IAC
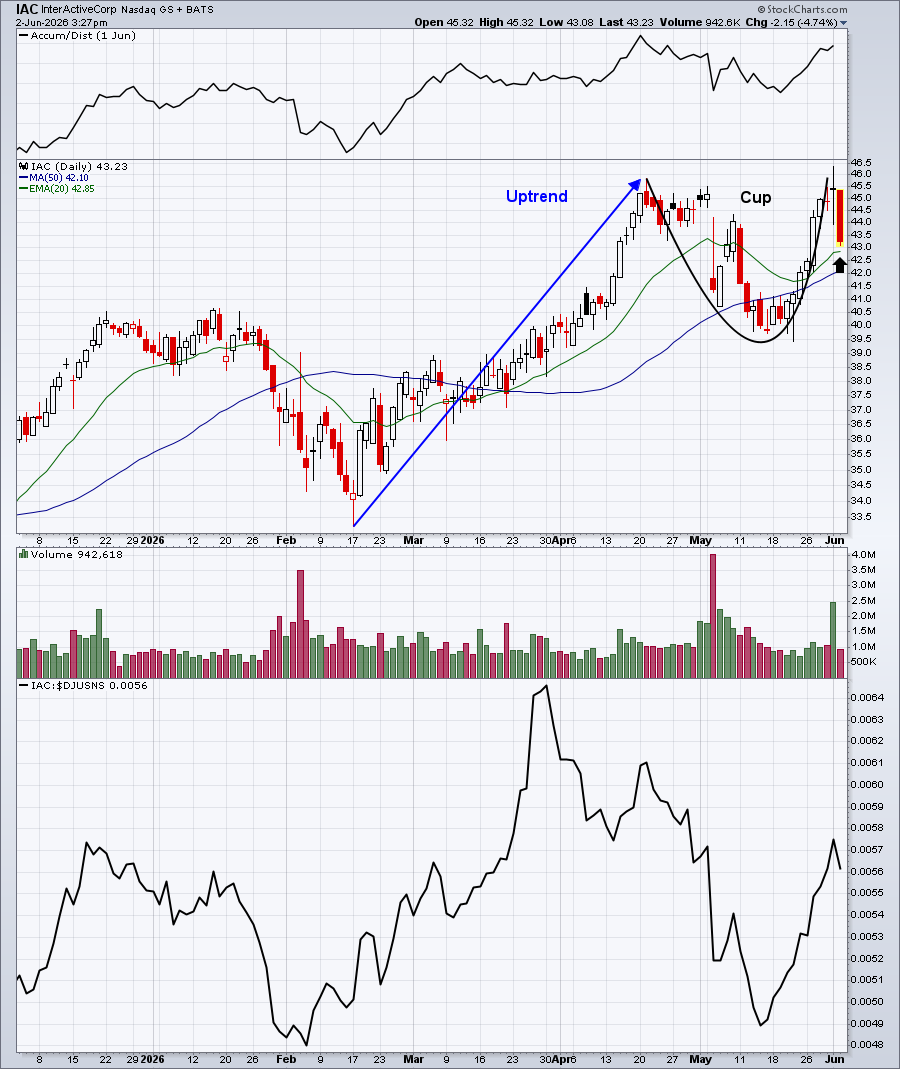
It looks to me like IAC has completed a very bullish cup with the ensuing weakness now forming a handle. Typically, a handle back to test the rising 20-day EMA, is a great spot for entry. Ultimately, a breakout above cup resistance would measure to the 51-52 range.
Upcoming Earnings
Our Upcoming Earnings ChartLists and Upcoming Earnings Relative Strength ChartList were provided for this week, but will not be included in the weeks ahead until Q2 earnings season begins in mid July.
Economic Reports
April JOLTS: 7.6 million (actual) vs. 6.9 million (estimate)
Happy trading!
Tom