
EB Daily Market Report - Wednesday, June 3, 2026
Executive Summary
- Futures were lower overnight and selling gripped our major indices at the open
- Weakness accelerated a bit in the morning session, though the bulls are trying reclaim control in the afternoon
- The ADP employment report showed a solid jobs market, slightly ahead of expectations
- The 10-year treasury yield ($TNX) did jump a bit higher on the news, potentially impacting small caps (IWM, 1.32%) negatively
- Crude oil ($WTIC, +2.50%) have been rising this week, and today is no exception; the higher crude is resulting in leadership from energy (XLE, 1.32%)
- Defensive sectors are performing well today as profit taking hits the aggressive sectors
- Technology (XLK, -0.77%) is off its lowest level today, but is being impacted by profit taking in software ($DJUSSW, -3.68%); IBM (-6.31%) is weighing also
- SanDisk Corp (SNDK, +5.75%) is setting another record high, helping semiconductors ($DJUSSC, +0.00%), which are flat on the session
Market Outlook
Mid cap stocks have been relatively weak, especially mid cap growth stocks. I want to show you two charts, however, that suggest this could be changing for the better.
First, I use a mid cap growth ($DJUSGM) vs. mid cap value ($DJUSVM) ratio as one of my sustainability ratios to help predict whether an S&P 500 advance (or overall market advance) is likely to continue. I want my sustainability ratios to be rising with the S&P 500. Well, until recently, this DJUSGM:DJUSVM ratio struggled to move higher:
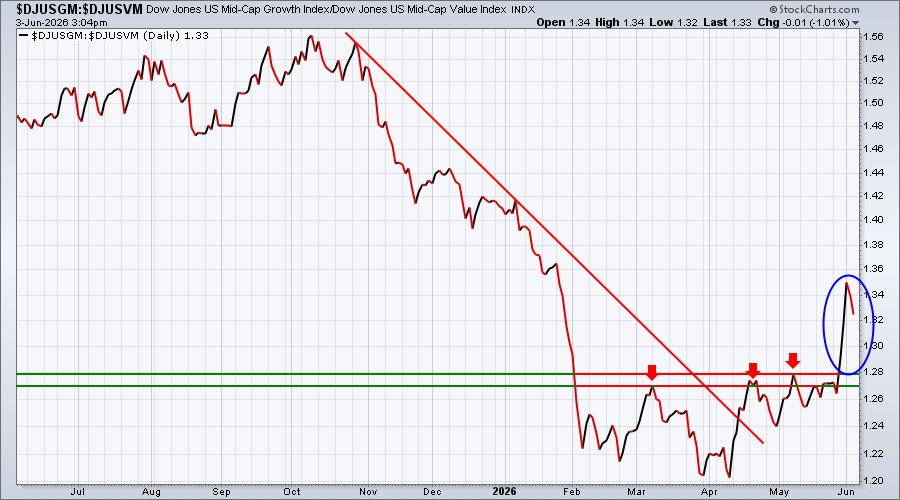
It's now broken out, however, which I believe is a very bullish development. Furthermore, if we simply look at the S&P 400 Mid Cap Growth ETF (MDYG) absolute performance, check out the potential breakout these past two days after a month-long consolidation in a cup with handle pattern:
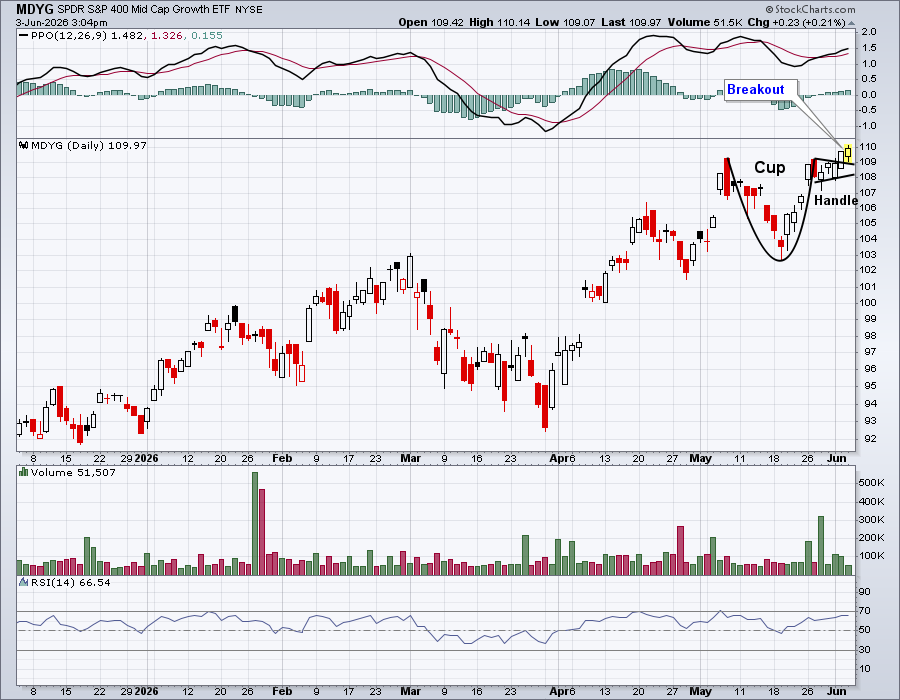
The initial move higher measures up to the 115 level, another bullish development amongst mid cap stocks.
Sectors/Industries
Profit taking from time to time is normal during extended rallies, so I'm not overly concerned with today's action. Occasionally, members will write in, asking me if I'm nervous because defensive areas are leading the market. Check out today's leadership:
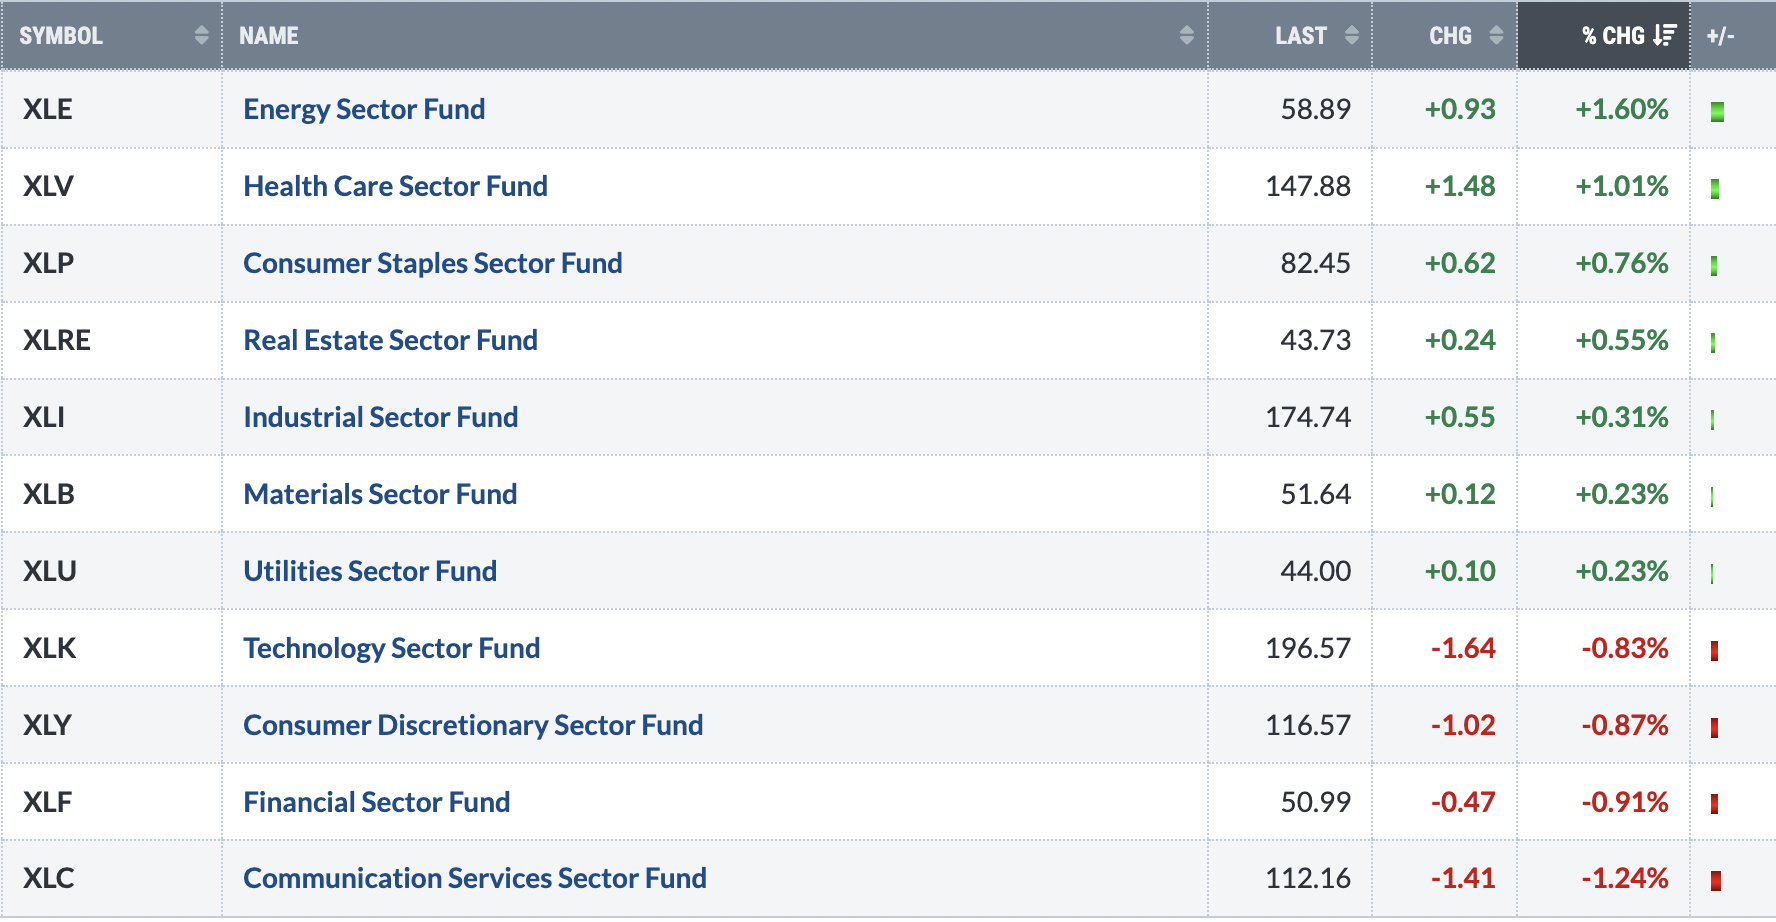
Don't confuse defensive leadership during profit taking and market pullbacks with defensive leadership as the stock market is making fresh all-time highs. They are completely separate signals. Today's strength in defensive areas is typical when we see a selloff following an advance. It's normal to see more profit taking in areas like technology, where recent gains are much larger. What makes the hair on my neck stand up is leadership in defensive sectors as we forge to all-time record high territory. The question that immediately pops into my head is, "Why is Wall Street rotating into defensive areas as the S&P 500 makes a new all-time high? In a bullish market environment, rallies are sustained by a risk-on mentality. Defensive shares leading is the OPPOSITE of risk-on."
ChartLists and Trading Strategies
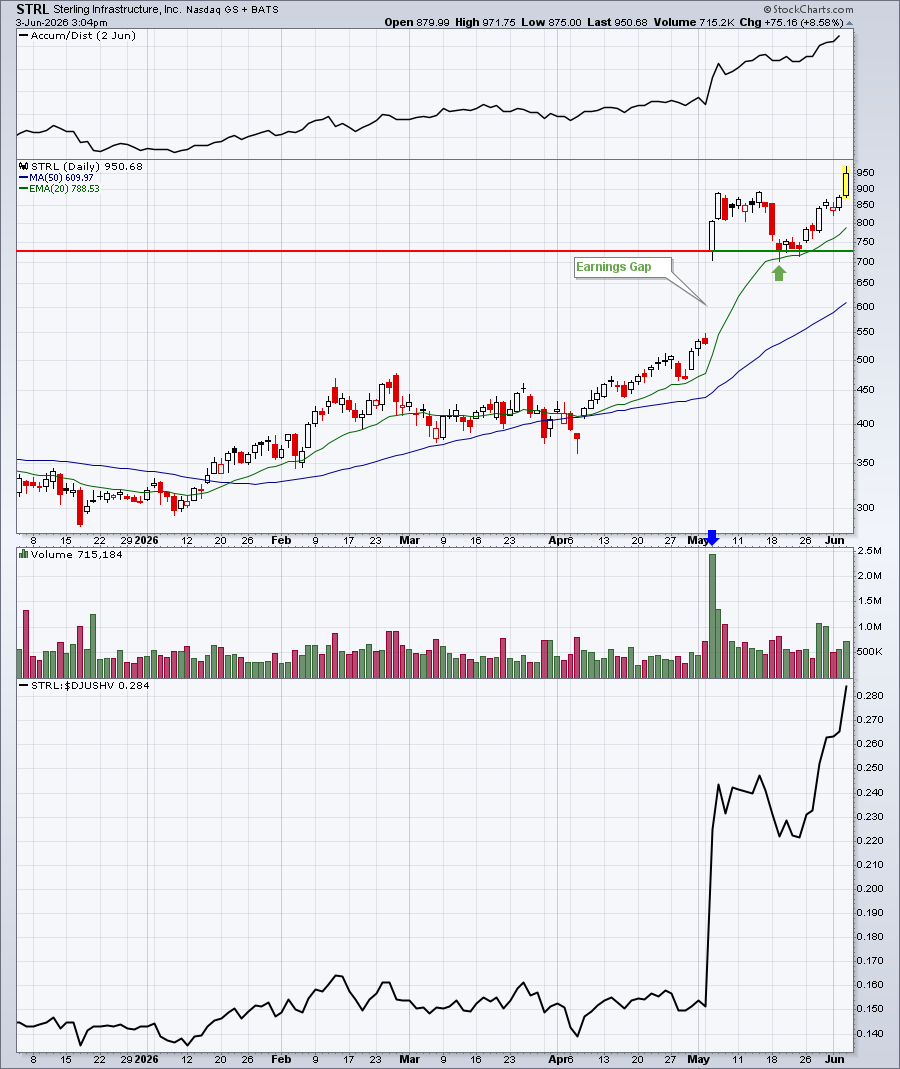
My favorite trade set up typically involves a stock that reported great quarterly results, gapped higher, continued pushing higher for a few days, and then retreats back to test the top of gap support. A recent example would be Sterling Infrastructure (STRL), which I featured two weeks ago in the DMR:
A current example of a similar stock that I added to today is Dell Technologies, Inc. (DELL):
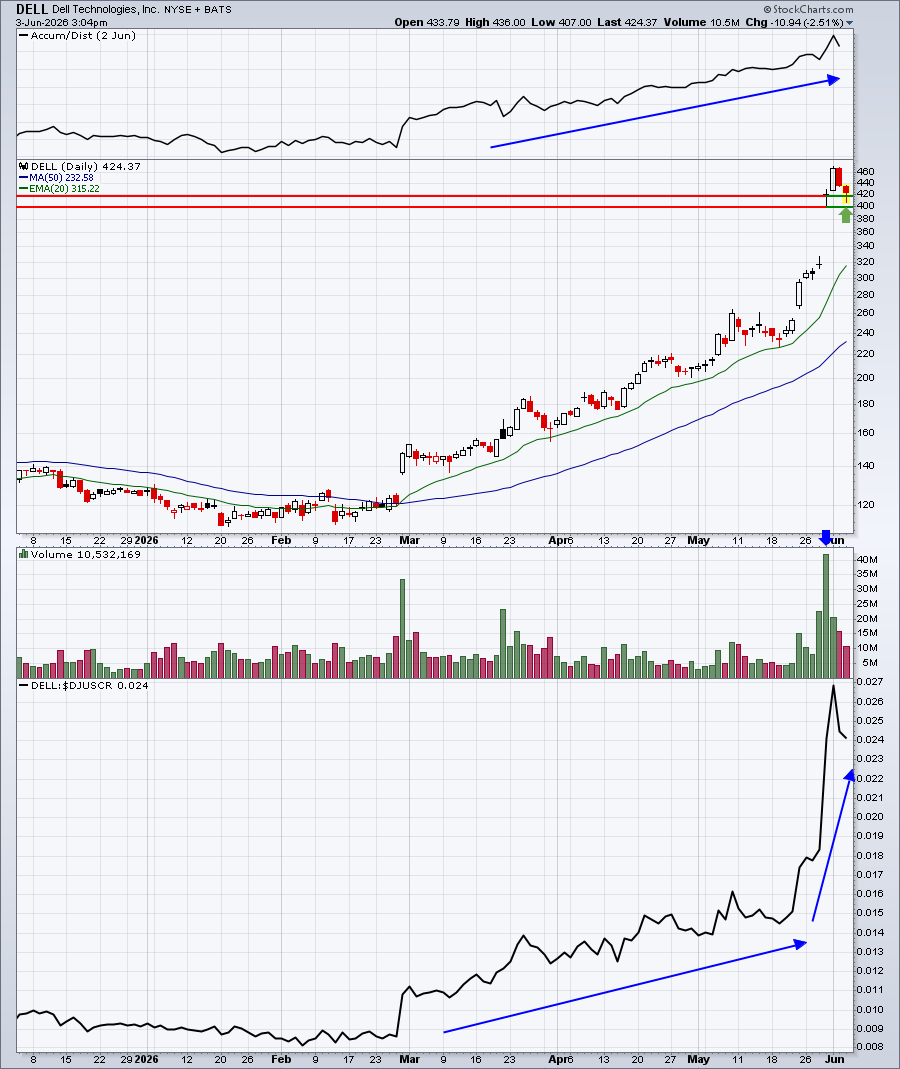
I'd like to see DELL reverse here and move back towards its recent high, breaking out again in time. It should be considered a very aggressive trade. If the low after earnings doesn't hold, I'll strongly consider exiting and taking a loss.
I also like trading the bottom of gap support if a stock pulls back immediately after strong earnings and a gap up. Versant Media Group, Inc. (VSNT) is an example as it is testing the bottom of gap support and its 50-day SMA simultaneously:
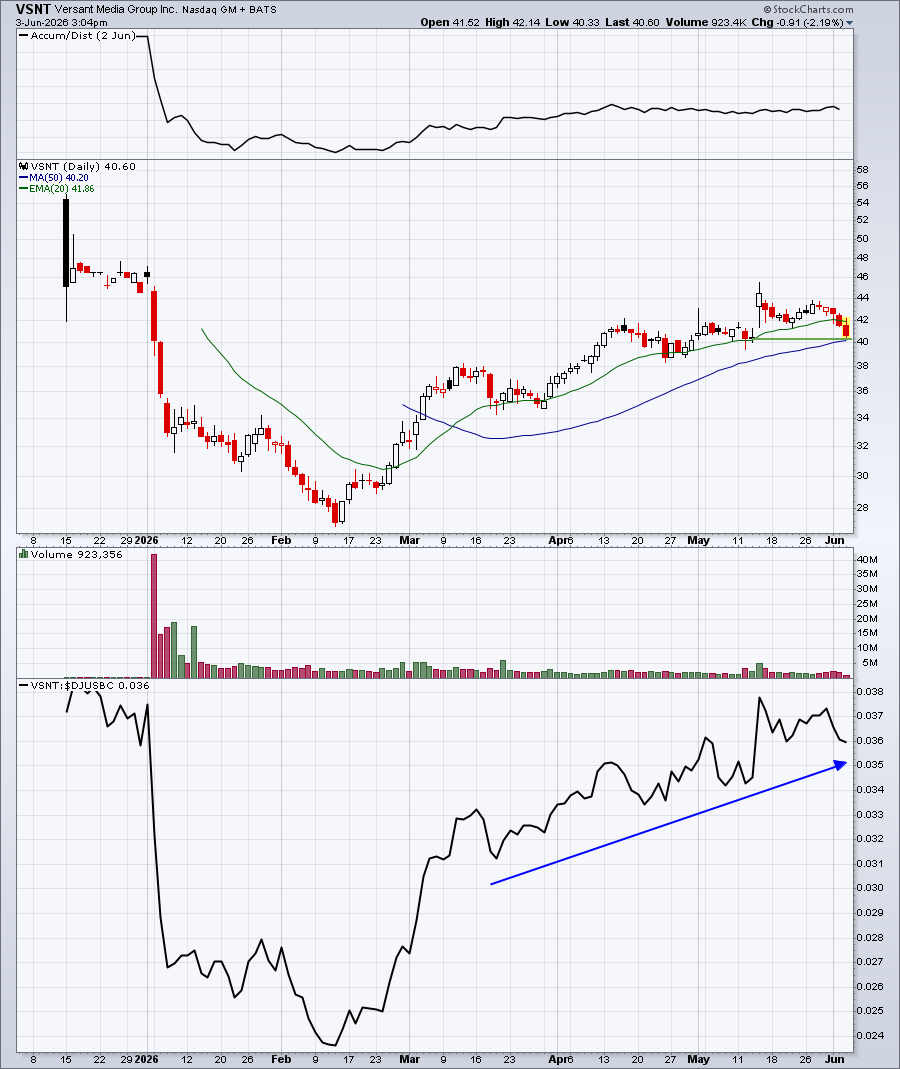
VSNT is not part of a particularly strong industry, nor does it have a fast-rising AD line, so it's not perfect. Therefore, I typically would only consider owning a stock like this if I could keep a tight stop in place. For me, that stop would be at 40.00. A close below that level would not only lose gap support, but would also lose the 50-day SMA.
Upcoming Earnings
Our Upcoming Earnings ChartLists and Upcoming Earnings Relative Strength ChartList were provided for this week, but will not be included in the weeks ahead until Q2 earnings season begins in mid July.
Economic Reports
May ADP employment report: 122,000 (actual) vs. 110,000 (estimate)
May PMI services: 54.5% (actual) vs. 53.9% (estimate)
April factory orders: +4.8% (actual) vs. +4.4% (estimate)
Fed beige book released at 2:00pm ET
Happy trading!
Tom