
EB Daily Market Report - Wednesday, June 10, 2026
Executive Summary
- Futures were lower overnight and remained down, despite a better-than-expected Core CPI number for May
- All of our major indices are lower by 1% or more (small caps are the exception, down 0.5%), with a little more than an hour left in today's trading
- All of our major indices are also currently trading below their respective 20-day EMAs and the NASDAQ 100 ($NDX) is trading below Friday's close
- Given negative divergences in play, the odds have increased that we'll see 50-day SMA tests on our key indices on this move lower
- Industrials (XLI, -3.02%) represent the worst-performing sector as transports ($TRAN, -2.56%) reverse after a recent steady advance
- Airlines ($DJUSAR, -5.23%) are particularly weak
- Technology (XLK, -1.89%) is having another rough session, sparked by further weakness in semiconductors ($DJUSSC, -3.51%)
- Energy (XLE, +2.00%) tops the sector leaderboard as crude oil ($WTIC, +2.37%) jumps above $90 per barrel
- Despite the significant recent rise in Volatility ($VIX, +9.66%) to almost 22, gold ($GOLD, -3.67%) will likely close below 4200 for the first time in 2026
- Oracle Corp (ORCL, -0.91%) is just below its 20-day EMA and testing price support, as it steadies for its latest quarterly earnings report - after the bell today
Market Outlook
One concern currently, and many of you have written in and asked questions about it, is the relationship between the consumer discretionary space (XLY) and consumer staples (XLP). It's most definitely a favorite sustainability ratio of mine. First and foremost, it has an excellent long-term track record of positively correlating with the benchmark S&P 500. So when it diverges, it's important to at least consider a potential warning sign.
Let's first take a look at that long-term positive correlation:
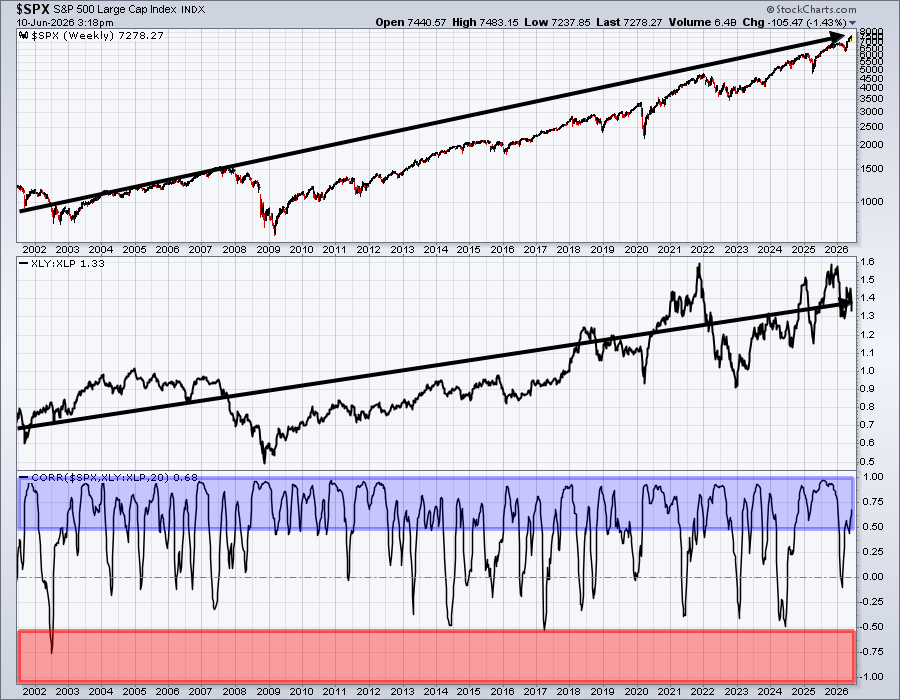
The thick black directional lines show that the XLY:XLP ratio moves higher over time, just like the S&P 500. It's not a perfect positive correlation, however, and we do see negative, or inverse, correlation emerge from time to time. Not every inverse correlation suggests a massive reversal in the S&P 500, but some do. It's important, therefore, to consider possible implications when the S&P 500 and the XLY vs XLP ratio are moving opposite one another.
In addition to the XLY:XLP closing ratio that it used in the above chart, I like to follow what is happening to this ratio on an "intraday basis" only. This ignores the impact of gap ups and gap downs and focuses entirely on how the XLY trades during the day vs. the XLP. After all, institutions cannot enter or exit positions at the opening bell. There isn't enough liquidity early in the trading day for that. Heck, sometimes I get railroaded trying to buy or sell 100 shares of a stock at the opening bell. You never know where a market order will get filled, because the spread between the bid and ask can be quite significant during the first few minutes of trading.
The "intraday" XLY:XLP ratio is updated every Monday morning in the Weekly Market Report. I show this ratio with and without gaps. Below is how they both look as of Tuesday's close (so updated for the activity the first two days of this week):
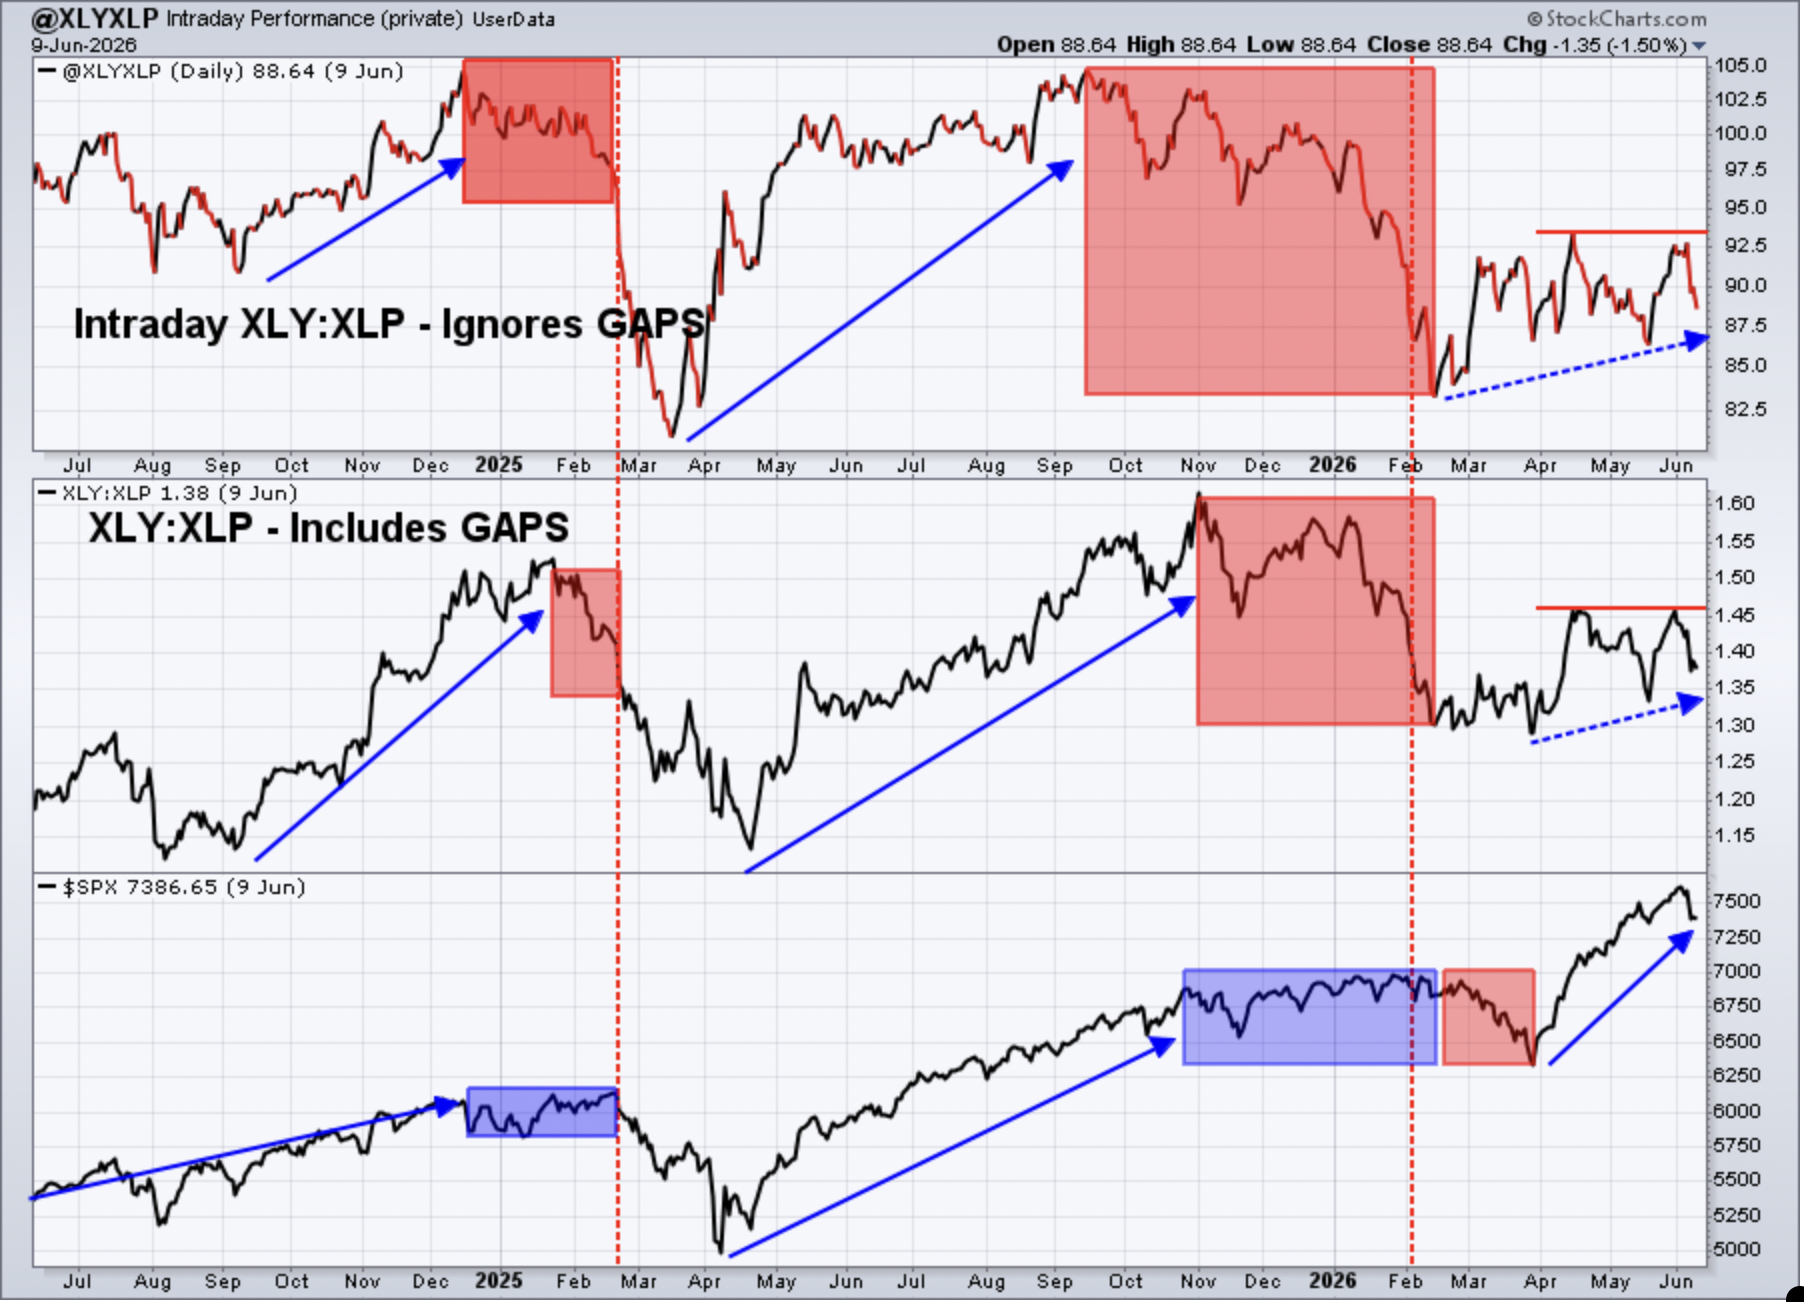
A break below the 2026 lows on the intraday and closing XLY:XLP ratio charts would be damaging technically, in my view. The recent sideways action is concerning, but when I consider this sideways action with my other sustainability ratios, most of which remain bullish, I'm not overly alarmed, and certainly not bearish.
Sectors/Industries
Several unsuspecting industry groups have turned from bearish to "potentially bullish" as money rotates away from technology. One of the biggest beneficiaries of this rotation has been insurance brokers ($DJUSIB):
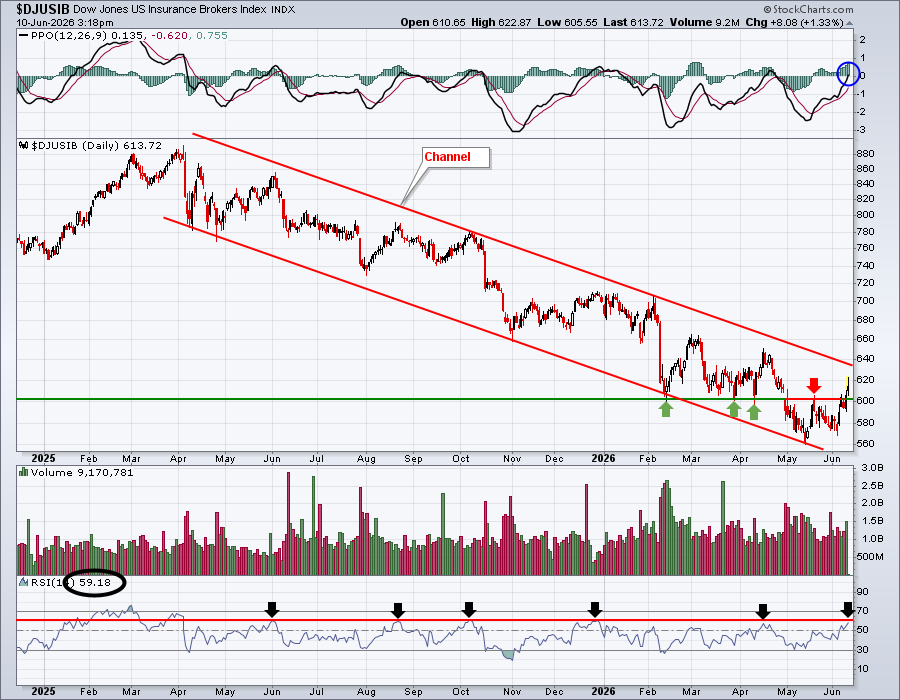
While the DJUSIB has been one of the best industry groups over the past week, I wouldn't say it's completely cleared key levels. I do like that it's cleared initial price resistance just above 600. The PPO has cleared centerline resistance, but that also occurred on short-term strength in April, December, and October, before rolling over again. The RSI 60 level, which usually rebuffs rally attempts during price downtrends, has slightly given way as the DJUSIB's RSI has crossed over 61. Look at the black arrows highlighting how RSI 60 has failed on many occasions throughout this downtrend.
So the signals right now are mixed. The insurance brokers group has definitely improved technically, given its past week of absolute and relative strength, but it's difficult to give the ALL CLEAR signal.
ChartLists and Trading Strategies
While technology pauses and relieves its short-term overbought oscillators, trading attention could be swayed to health care stocks (XLV), which have broken out of a sideways trading pattern and are now trending higher. Here are two stocks that are certainly much safer than technology stocks and appear to be in solid uptrends:
Johnson & Johnson (JNJ):
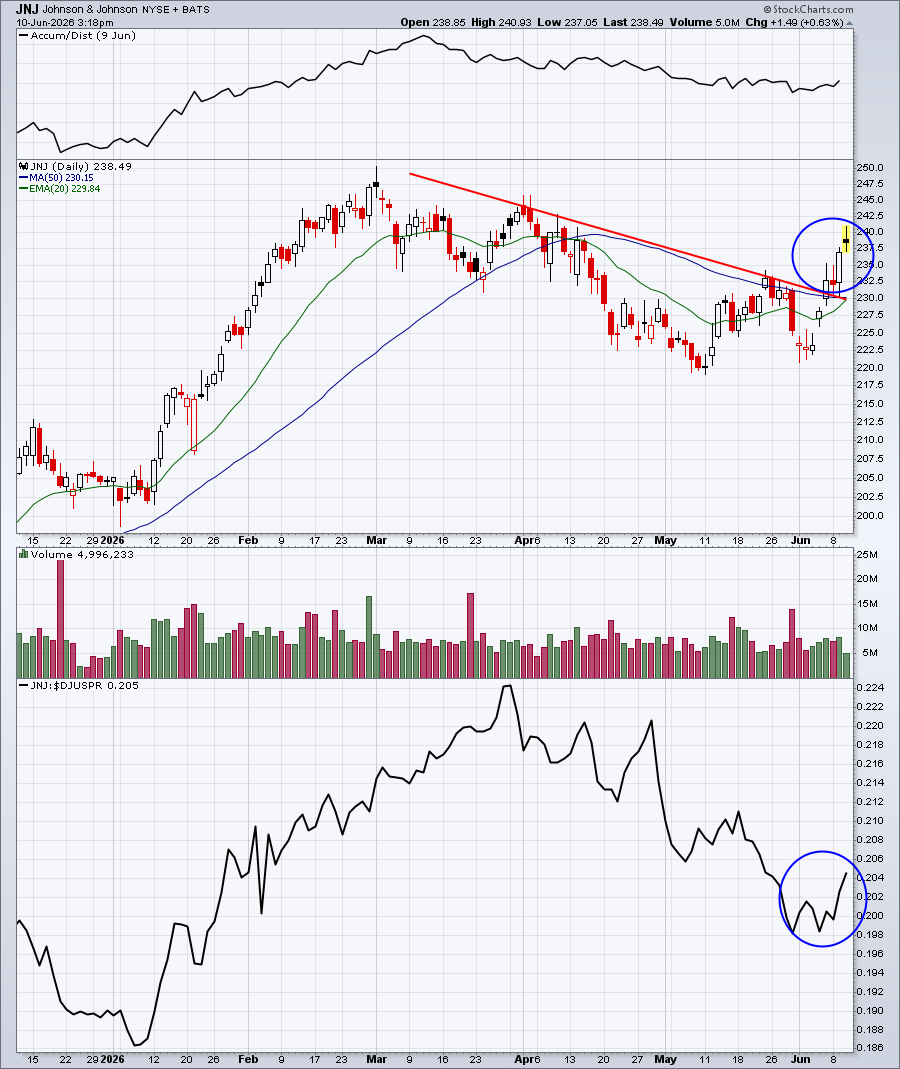
Since breaking its downtrend, JNJ's relative strength has also begun to ramp up. So long as JNJ remains above its now-rising 20-day EMA, which is just about to cross above its 50-day SMA, I believe it's a solid trade.
Jazz Pharmaceuticals (JAZZ):
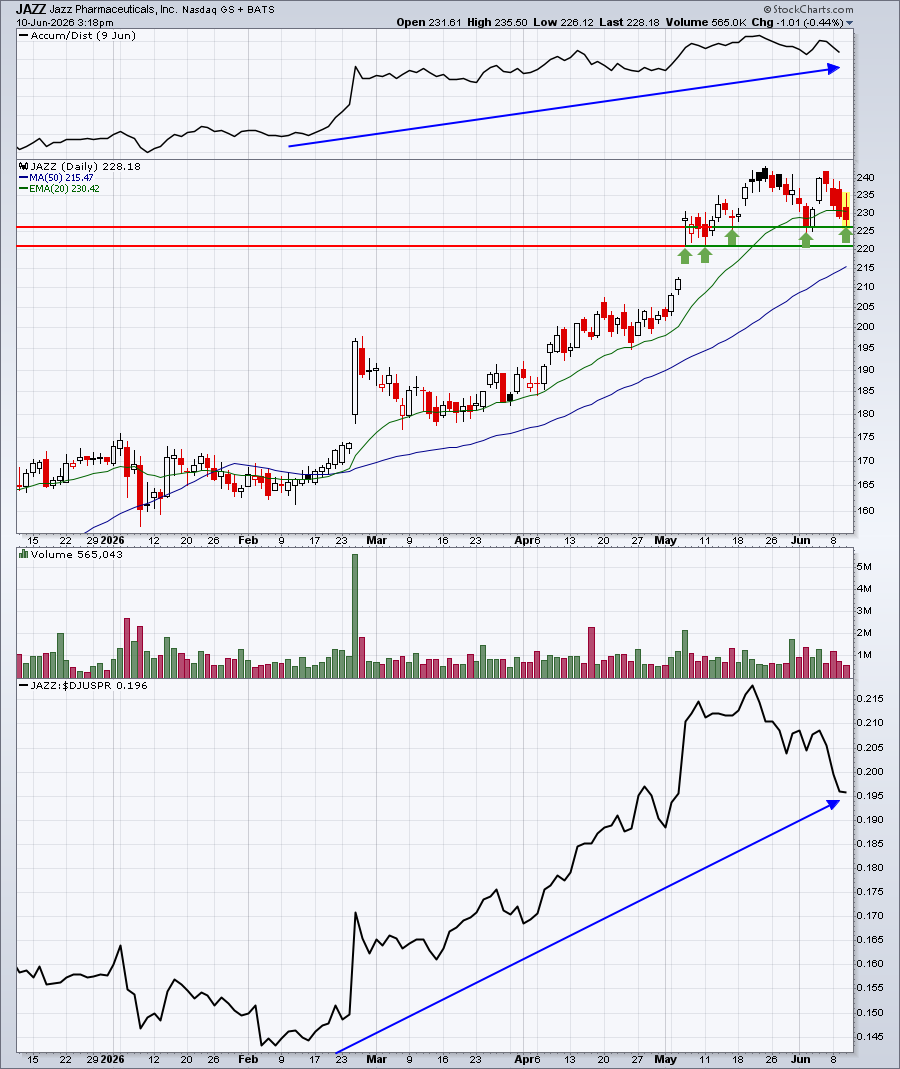
JAZZ has actually pulled back a bit, while the health care group has bounced. I believe that sets up a stronger reward-to-risk entry. The green arrows mark a solid price support range, while I'd be looking for a breakout above the May high in the not-too-distant future.
Upcoming Earnings
Our Upcoming Earnings ChartLists and Upcoming Earnings Relative Strength ChartList will not be provided in the weeks ahead until Q2 earnings season begins in mid July.
Economic Reports
May CPI: +0.5% (actual) vs. +0.5% (estimate)
May Core CPI: +0.2% (actual) vs. +0.3% (estimate)
Happy trading!
Tom