
EB Daily Market Report - Thursday, June 11, 2026
Executive Summary
- Futures were up overnight as our major indices look to recover from recent losses
- Around noon ET, transports ($TRAN, +1.85%) and the NASDAQ 100 ($NDX, +1.10%) were leading
- Semiconductor equipment manufacturers were very strong with KLA Corp (KLAC, +8.76%) and Lam Research (LRCX, +8.56%) atop the S&P 500
- As a group, semiconductors ($DJUSSC, +2.21%) were aiding technology's (XLK, +1.09%) attempt at a rebound
- Industrials (XLI, +1.50%) are being led higher by a very strong trucking group ($DJUSTK, +3.12%)
- Bitcoin ($BTCUSD, +1.10%) is up after testing February's low and key support at 60000
- Commodities are mixed with crude oil ($WTIC, +1.06%) near $91 per barrel
- May PPI jumped 1.1% and Core PPI rose 0.8%, both well ahead of consensus estimates
- The 10-year treasury yield ($TNX) is down a basis point to 4.53%, despite this morning's hot read on inflation
- Oracle Corp (ORCL, -11.79%) is down significantly after reporting disappointing cloud revenue, and despite beating its earnings estimate
Market Outlook
I know that one argument of the bears is that there hasn't been enough participation in this bull market and that, therefore, is counterproductive and we're going to top soon, if not already. I simply don't buy into that argument. I want to show you a chart of the aggressive (other than technology) and defensive sectors and how they've performed during this entire secular bull market:
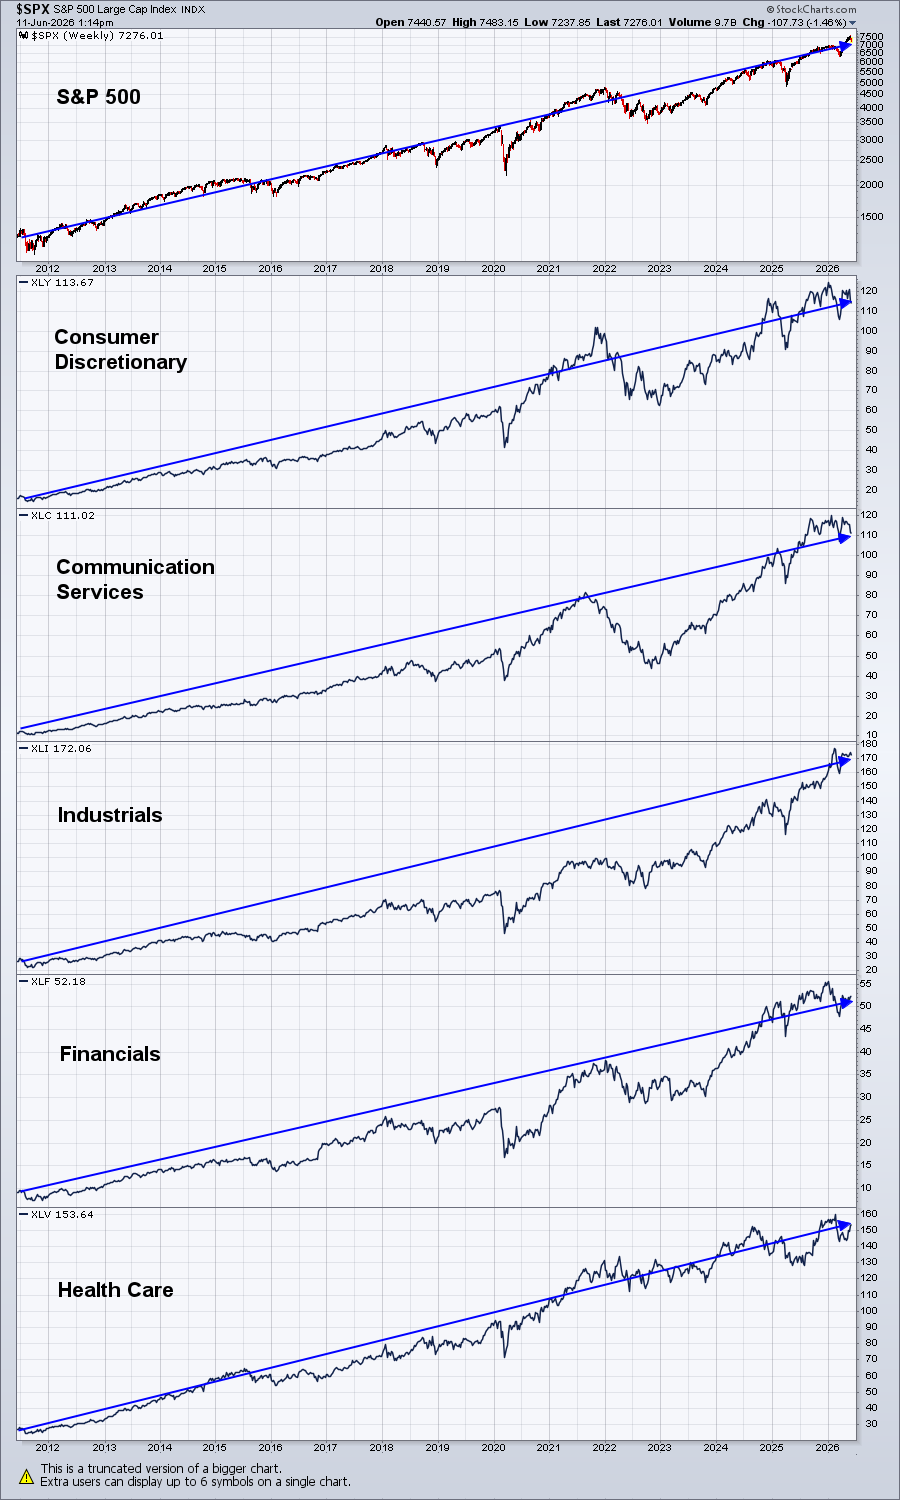
I want you to do me a favor. Check out the 15-year performance in each of the 8 sectors shown and identify for me the sector(s) that haven't performed well during this bull market.
When the secular bull market mode really kicks in, it's the high-octane growth areas that lead, primarily technology. That's completely normal and should be expected, not criticized. That's exactly what we want to see. Yet many technicians, especially those who highly prioritize breadth, can't seem to ever get behind one of the best bull markets of our lifetime.
Personally, I see every sector rising. Technology just happens to house many of the fast growers and, I'm sorry, but earnings and rapid earnings growth is what gets rewarded, especially in a low interest rate environment.
Sectors/Industries
Transportation stocks, and the signal they provide, have always been very important. Every year, during our annual MarketVision event, I provide a chart of transports ($TRAN) showing that the S&P 500's best performance typically occurs when the TRAN is trending higher. Check out this chart:
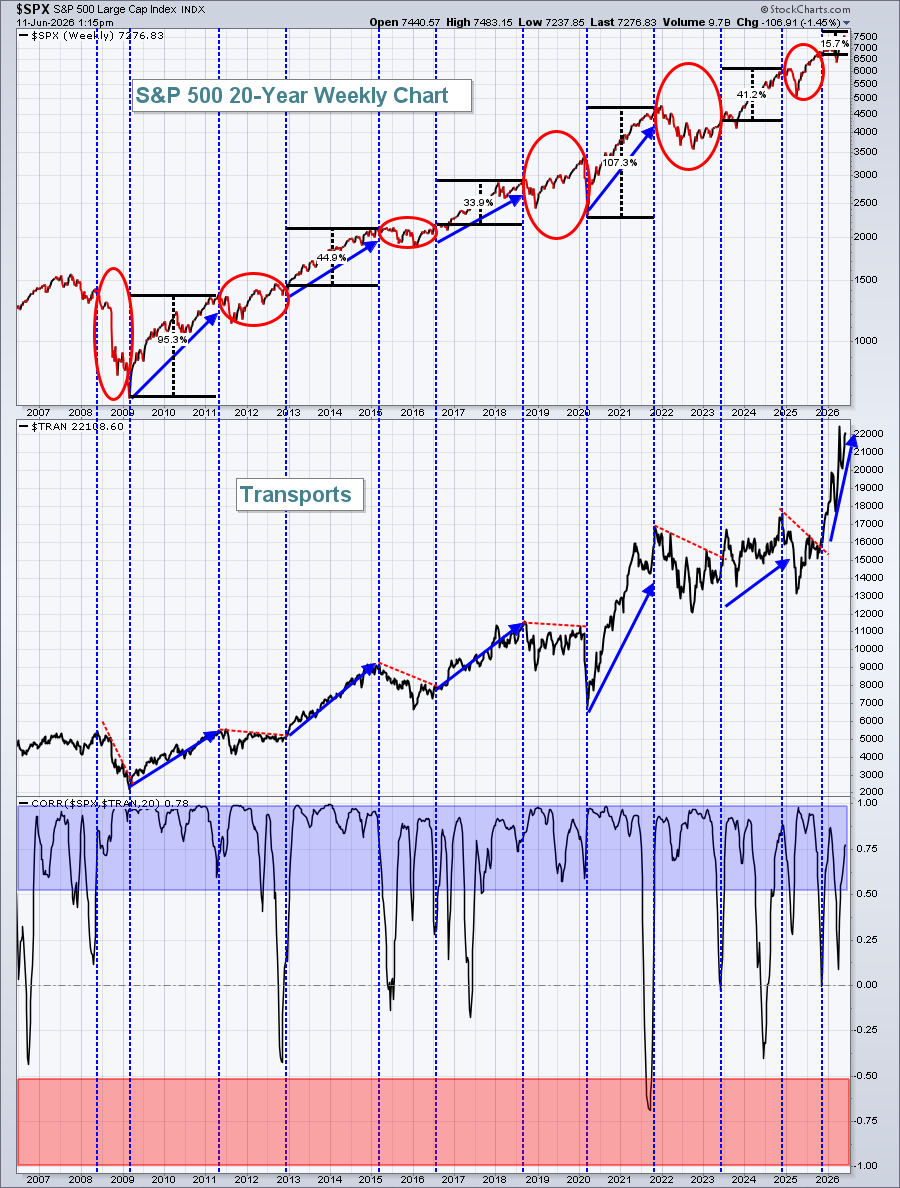
Check out those red circles. The S&P 500 tends to struggle when transports struggle. Doesn't that just make perfect common sense? Transports rise when economic conditions are either strong or expected to strengthen. These stocks only go up because more goods are shipped or will be shipped. They are very economically sensitive.
From looking at the chart, it's very obvious to me that when transportation stocks are performing well, the S&P 500 moves higher. Period. And what are transportation stocks doing right now? They're screaming higher.
So when you look at one specific chart and try to make a determination that the stock market is overvalued, just keep one thing in mind. The stock market is a massive jigsaw puzzle with many, many pieces. You can't pick up one piece and try to solve the puzzle. Before you can make an overall assessment of stock market conditions and hope to correctly identify its next move, either higher or lower, you need to put the majority of the pieces together in order to visualize the entire picture.
Just picking one piece and making a market call is called confirmation bias. You believe the stock market is going higher or lower and then you look for something.....ANYTHING....to support your case. That approach gets you in a lot of trouble. Try to remain objective and, whatever you do, IGNORE THE MEDIA AND THE HEADLINES!
ChartLists and Trading Strategies
Some traders like to trade something easy, like key price support. I think that's a solid and disciplined approach. The best price support is one that's been tested multiple times, with successful bounces every time in the past. Here's a stock that raised guidance this week and has fallen back well over 10% to test a fairly strong support level:
ASO:
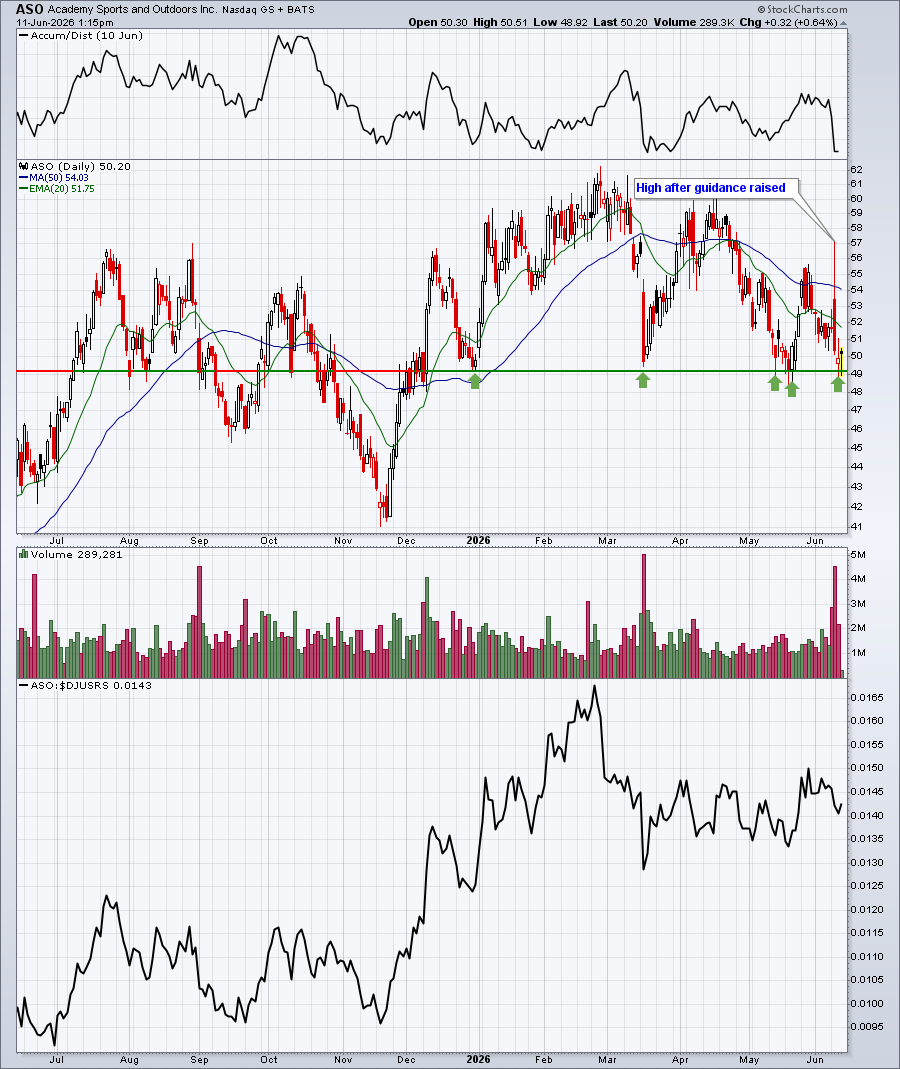
Is this a perfect trade candidate? No. Honestly, I'm not a fan of the weak AD line. But what I do like is that ASO has not closed below 49.00, despite trading below that level on an intraday basis multiple times in 2026. Also, after guidance was raised, ASO hit 57.00. During each of the two days since, ASO has tested 49.00 successful (thus far). From a reward to risk perspective, it's a great trade, because any close below 49.00 would trigger a closing stop for me. That limits the downside risk. There still remains the risk of a big opening gap lower, but that's the case with any stock that's held overnight.
Upcoming Earnings
Our Upcoming Earnings ChartLists and Upcoming Earnings Relative Strength ChartList will not be provided in the weeks ahead until Q2 earnings season begins in mid July.
Economic Reports
Initial jobless claims: 229,000 (actual) vs. 220,000 (estimate)
May PPI: +1.1% (actual) vs. +0.7% (estimate)
May Core PPI: +0.8% (actual) vs. +0.4% (estimate)
Happy trading!
Tom