
EB Daily Market Report - Tuesday, June 16, 2026
Max Pain Event Today
Our monthly Max Pain event will be held today at 5pm ET for June. We sent out room instructions earlier and will have an interesting discussion as our major indices remain fairly close to all-time highs, with plenty of net in-the-money call premium on the table. I hope you can join us this afternoon. If not, no worries, as we'll make sure everyone receives a recording of the event later today or tomorrow.
Executive Summary
- Futures were up slightly overnight and the Dow Jones has shown strength throughout today's session
- The other major indices are struggling, led to the downside by the NASDAQ 100 ($NDX, -1.37%)
- Semiconductors (SOXX, -3.78%) are particularly weak, perhaps due to upcoming June monthly options expiration on Friday
- The latest Fed meeting kicked off this morning and it's new Fed Chief Warsh's first meeting as the Chief
- It is widely anticipated that there'll be no rate change tomorrow, but will the tone change under new leadership and with the agreement with Iran?
- Cryptocurrencies are pulling back after their recent strength; bitcoin ($BTCUSD, -1.02%) is back just beneath 66000
- Commodities, other than crude oil ($WTIC, -6.15%), are rebounding
- Gold ($GOLD, +0.26%), which neared 4000 per ounce a few days ago, has jumped back to nearly test its declining 20-day EMA, currently at 4400
- Technology (XLK, -1.98%) is easily the laggard among sectors, one day after strong gains were posted
- Financials (XLF, +1.32%) and industrials (XLI, +1.14%) are showing considerable relative strength today; banks ($DJUSBK, +2.01%) are strong
Market Outlook
We're seeing a bit of red in the market today and it always begs the question, "Is this THE drop?" First of all, I'm not really looking for a significant drop, so that question isn't going through my head at the moment. However, it is the slower summer months now, and consolidation has been more of the norm throughout the summer months. We also rallied strongly heading into the announcement over the weekend that the U.S. had reached a deal with Iran to open the Strait of Hormuz. Crude oil ($WTIC, -6.15%) promptly tumbled on Monday and is lower again today. That should help to mitigate some of the inflation banter. The bond market would agree, as the 10-year treasury yield ($TNX) has dropped to 4.42% today, which would represent the lowest close on the TNX in over a month.
Did I mention it's June monthly options expiration week? This can sometimes derail a market rally as market makers look to fleece the unsuspecting options bulls, potentially wiping out billions of dollars of net call premium. The hottest area of the stock market has been semiconductors, so I'm certainly not shocked to see that this group is struggling with options expiration right around the corner. The iShares Semiconductor ETF (SOXX) has gap support from Monday's open at 595.54. Selling down to that level could be considered normal technical behavior, but a close beneath it could signal more options-related selling ahead. I'll be discussing this later at our Max Pain event, which starts at 5pm ET, but the SOXX has max pain at 560. While we could see a very significant selloff down close to 560 to wipe out a lot of net call option premium, instead I simply view this information as a possible directional clue for both semiconductors and our major indices, which all show max pain beneath current price. Again, I'll discuss this more at 5pm ET today.
Sectors/Industries
Commercial vehicles & trucks ($DJUSHR) has been a strong leader during this secular bull market advance, as you can see on this chart:
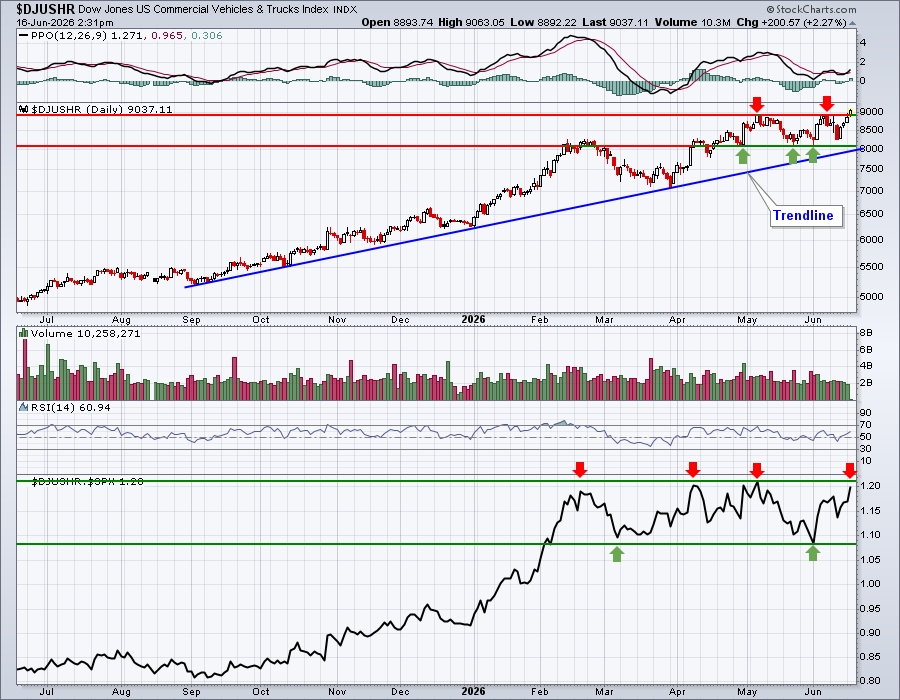
The group appears to be breaking out on its absolute chart, but hasn't yet done so on its relative chart. I'd be more bullish if we see both, but I'd at least be looking at key leading stocks within this space on our ChartLists. For instance, on our Strong Earnings ChartList (SECL), the best relative performers in the DJUSHR, based on SCTR scores, is CAT (91) and CMI (84). CAT is also attempting another breakout today.
ChartLists and Trading Strategies
I personally like to trade off the Strong Earnings (SECL) and Raised Guidance (RGCL) ChartLists. It's probably the CPA inside me that simply prefers owning stocks that show strong and/or improving fundamentals, in addition to solid technical price action. On the RGCL, Tilly's Inc. (TLYS) recently raised guidance and traded as high as 5.90 after guidance was hiked on June 4th. A little more than one week later and TLYS has fallen back to 4.77 and is now just beneath its 20-day EMA. It's worth noting that TLYS showed recent price support at 4.53 after raising guidance and it also has gap support at 4.44. I'd expect that 4.44-4.53 range to hold as support, with a possible return to its intraday high on June 4th as a potential target. Here's the chart:
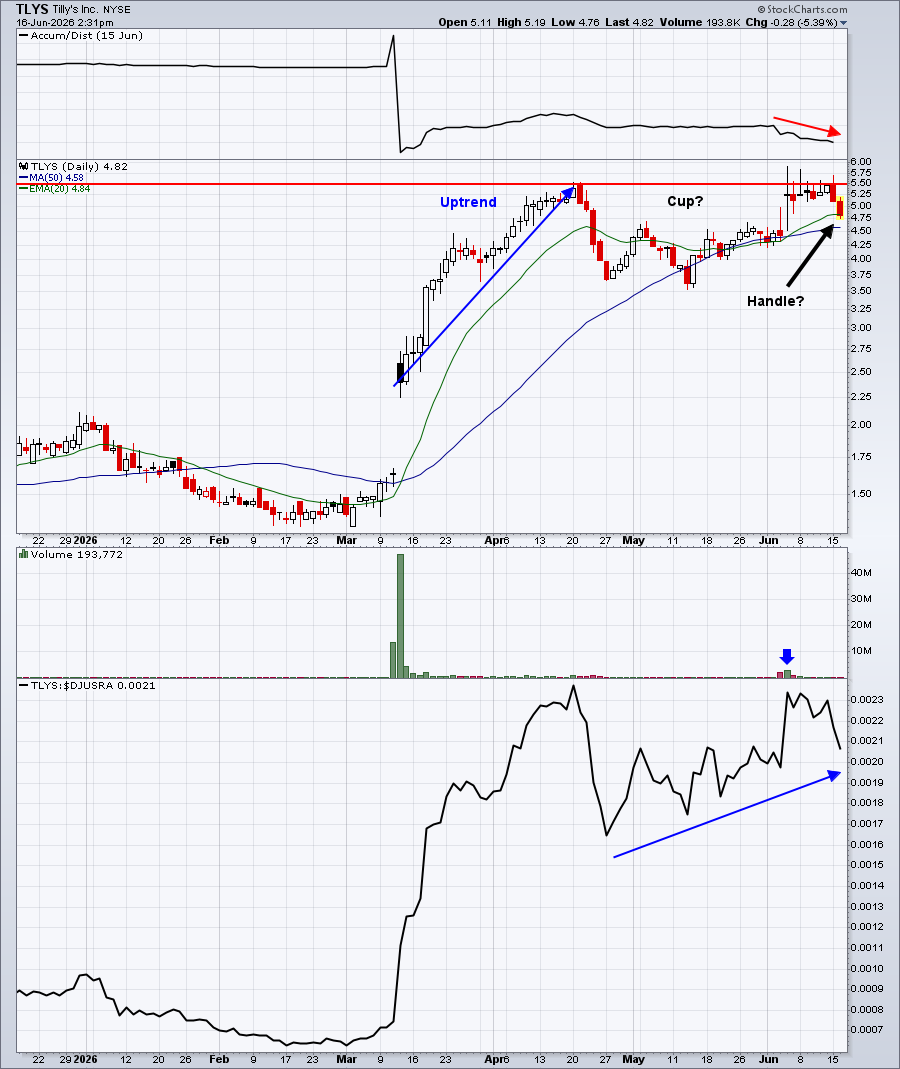
Apparel retailers ($DJUSRA) have been improving over the past month, relative to the benchmark S&P 500. Assuming that continues, TLYS could be a significant beneficiary.
Upcoming Earnings
Our Upcoming Earnings ChartLists and Upcoming Earnings Relative Strength ChartList will not be provided in the weeks ahead until Q2 earnings season begins in mid July.
Economic Reports
FOMC meeting begins
May housing starts: 1,170,000 (actual) vs. 1,430,000 (estimate)
May building permits: 1,410,000 (actual) vs. 1,420,000 (estimate)
Happy trading!
Tom