
EB Daily Market Report - Wednesday, July 8, 2026
Upcoming Schedule
Beginning next Wednesday morning, July 15th, I will be traveling out of town for an annual golf trip. For the most part, it'll be business as usual. I'll have my computers with me and plan to work on both Thursday and Friday. However, there will be 2 parts of our service impacted.
First, I will be in travel mode early on Wednesday morning, so next week's Live Trading Room will be cancelled. I won't likely be back home until late Sunday evening, so there will be no Weekly Market Recap video on YouTube this weekend. Otherwise, unless specifically mentioned during upcoming days, everything else should be "business as usual."
I'll send out another reminder next week, but I wanted to give everyone plenty of time to plan for the changes.
I usually have three of these extended golf weekends over the summer months, one in June, one in July, and one in August. There'll be limited impact from this one, but I still like to keep everyone updated.
Executive Summary
- Futures were down overnight and our major indices gapped lower
- It's been mostly a negative day, though technology (XLK, +0.89%) has shown some resilience and strength
- Energy (XLE, +1.25%) is the strongest sector, as crude oil ($WTIC, +4.22%) has jumped to $73 per barrel
- The 10-year treasury yield ($TNX) surged to close to 4.60% earlier, but has retreated back to 4.57%
- The Fed released its latest minutes and, to summarize, I'd say that Fed officials are awaiting more information before deciding on their next policy move
- Cryptocurrencies are under some pressure today, though bitcoin ($BTCUSD, -2.40%) remains well above its recent low near 58000
- Most commodities, other than crude, are lower on the session, with silver ($SILVER, -3.94%) down significantly
- Semiconductors (SOXX, +1.91%) are attempting to stave off selling pressure at key 50-day SMA tests; so far, they're successful
- Large-cap growth stocks (IWF, +0.18%) have reversed to trade higher, easily outperforming large-cap value (IWD, -0.97%), thanks in large part to recovery in semiconductors
Market Outlook
Yesterday, I discussed sustainability ratios. Let me say that NOTHING is more important than actual price action. A breakout is a breakout. An all-time high is BULLISH. An uptrend is BULLISH.
I use "under the surface" signals like sustainability ratios to evaluate the health of an advance, not to determine IF it's an advance. Price action dictates that. Without question, our major indices are in uptrends. If you ever need to look at whether we're trending up or down, here's a good S&P 500 chart to start with:
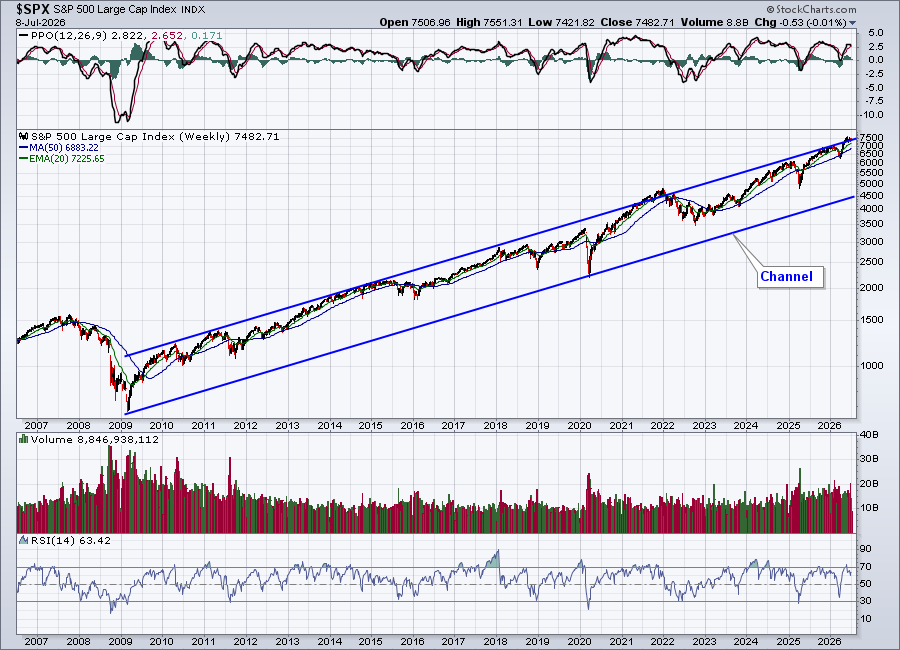
You can argue whether we're overbought, and what that might mean in the short-term to intermediate-term, but you really can't argue about whether we're trending higher.
Sectors/Industries
One thing that I've learned over the years, and now teach often, is that negative divergences increase short-term risk. That doesn't guarantee a selloff. There's a big difference. If I'm looking to a buy a stock or an ETF that has a negative divergence, I need to understand that I'm taking on more risk if I decide to buy before a PPO centerline and/or 50-period SMA test print on that chart. I feel like I'm taking less of a risk if I get a selloff down to a 50-period SMA test prior to buying.
Let me give you a current example.
I've been discussing the negative divergence on the semiconductors group (SOXX) for weeks. When I see it, I understand that the odds INCREASE that I'll get a 50-period SMA test. If I buy at the 20-day EMA, then I take on the risk of a further drop to the 50-day SMA. If I wait on the 50-day SMA test to buy and the SOXX never tests that level, then there's a risk that I'll miss the next rally. Every trader/investor must consider these different risks and then decide when and where to buy based on their individual risk tolerance levels.
I bought the SOXX today, for full disclosure. I believe the 50-day SMA presents a solid reward-to-risk opportunity for entry. I believe the 20-WEEK EMA presents the best opportunity for entry, but I don't know if we'll get that test soon and prior to another rally in the group. So I had to make a decision.
I'll show you two pertinent charts, first the daily chart and the 50-day SMA test after the negative divergence. Then, I'll show you a strong PPO on the weekly chart and the rising 20-week EMA:
SOXX Daily Chart
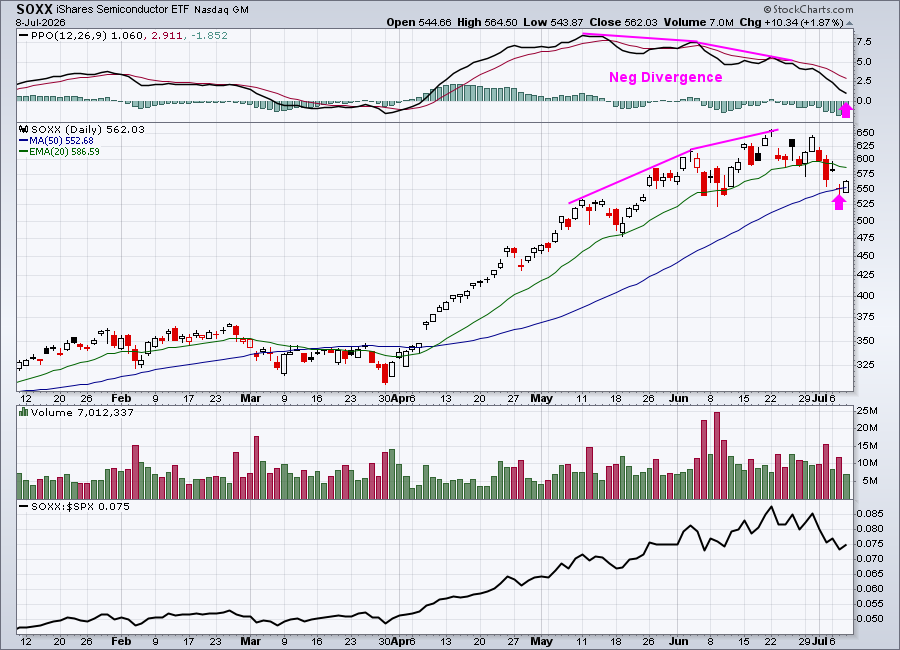
The pink arrows highlight what I look for AFTER a negative divergence prints. It doesn't mean that price action cannot go lower. It simply means that a lot of risk previously present....is no longer present.
SOXX Weekly Chart
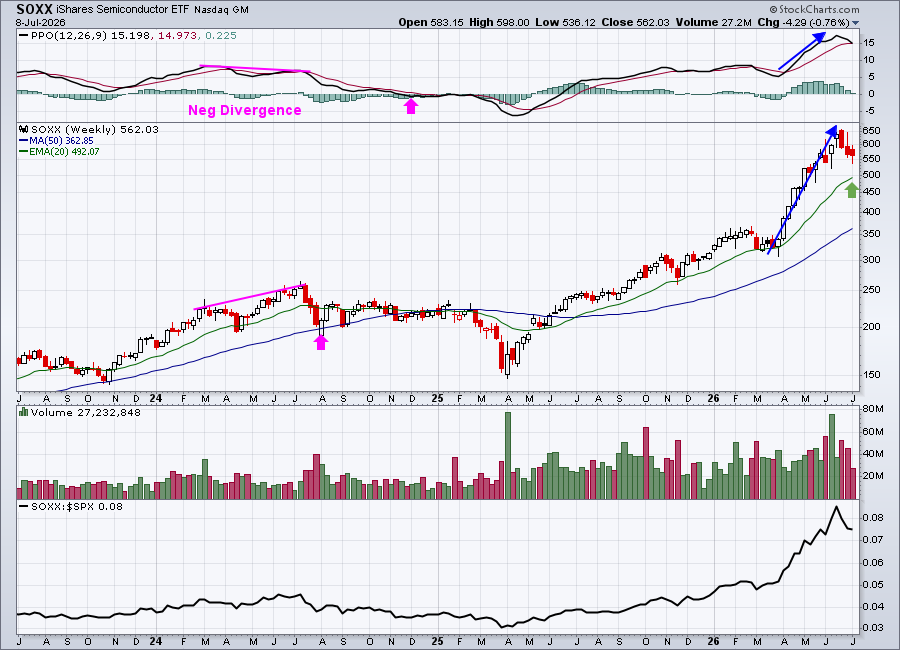
I showed a negative divergence on this longer-term weekly chart and you can see that it takes more time to get rid of a negative divergence on a weekly chart. I usually look for a negative divergence on a daily chart to impact trading for anywhere from 1-3 weeks, where a negative divergence on a weekly chart would be more like 1-3 months.
Given the strength of the current weekly PPO, I believe the rising 20-week EMA provides the absolute best support......if we get that low. 20-week EMAs don't get tested every time we get a pullback. Many times, buyers step in earlier off of support on the daily chart.
So, back to that haunting question. Where and when is the best time to buy? I think it's up to the eyes of the beholder and how much risk you're willing to assume.
ChartLists and Trading Strategies
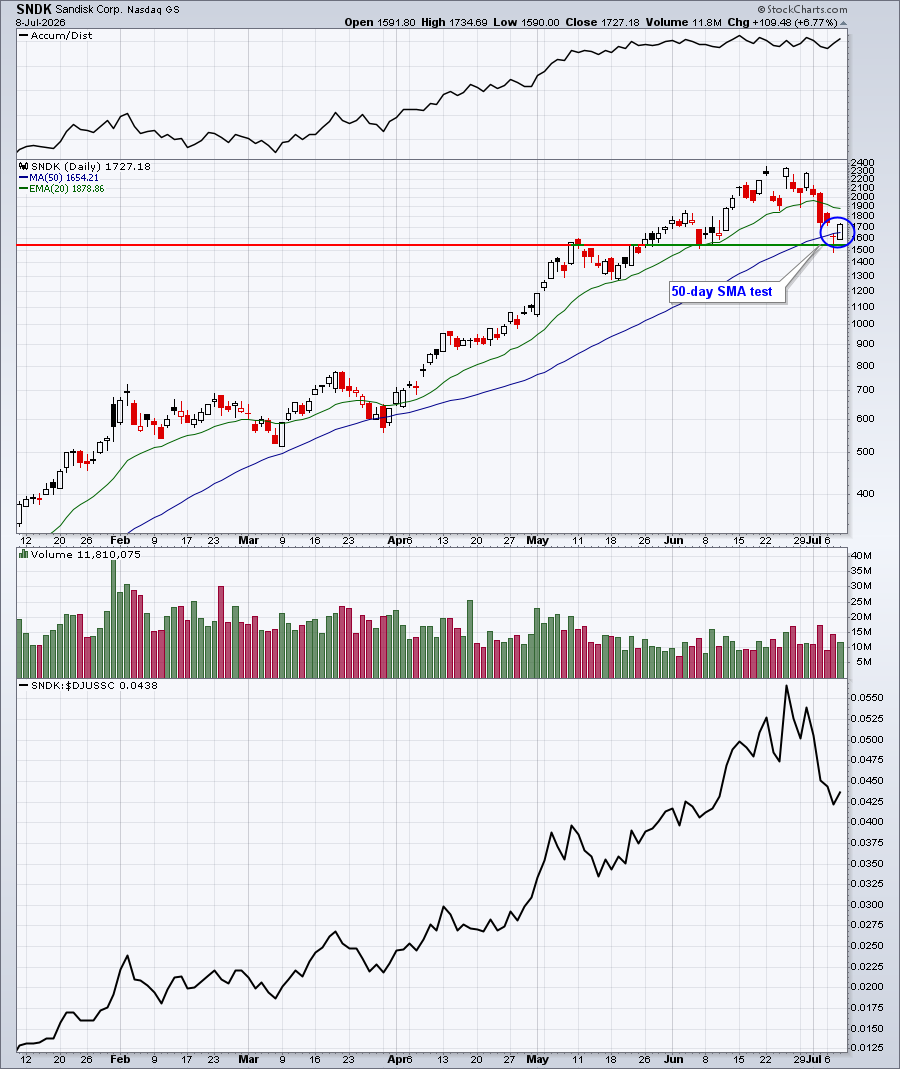
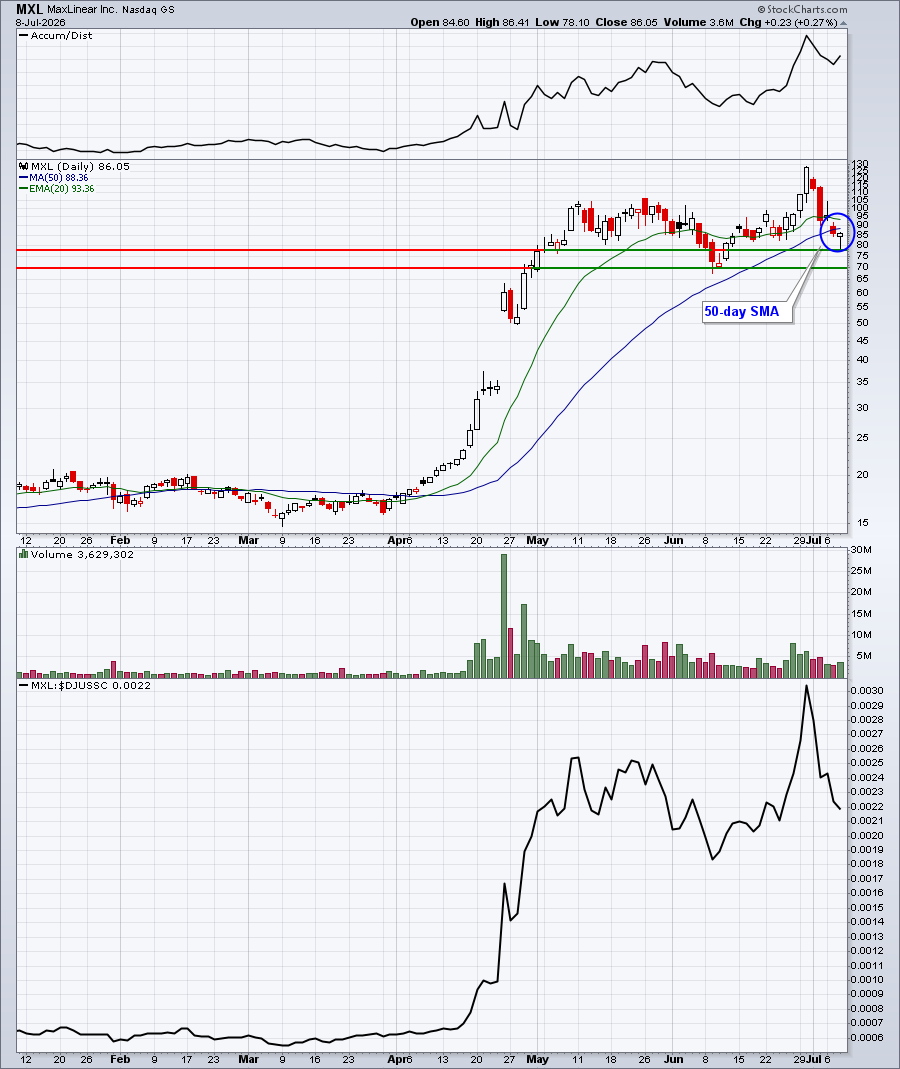
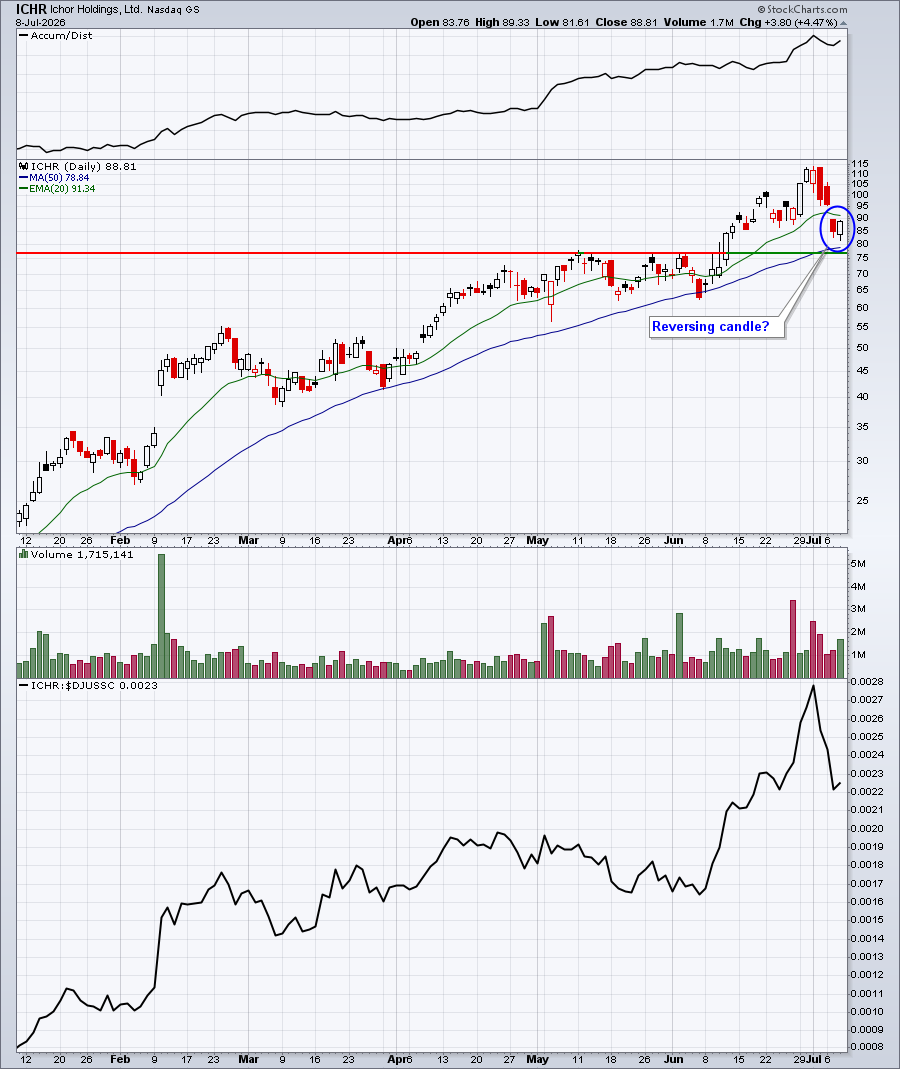
Many semiconductor stocks have reached key price and/or moving average support on their daily charts. I can't tell you, with certainty, whether these support levels hold, but what I can say is this. The recent selling has significantly improved the reward to risk on leaders in this space.
Here are a few leaders in semis that look interesting after the recent selloff:
SNDK
MXL
ICHR
MU
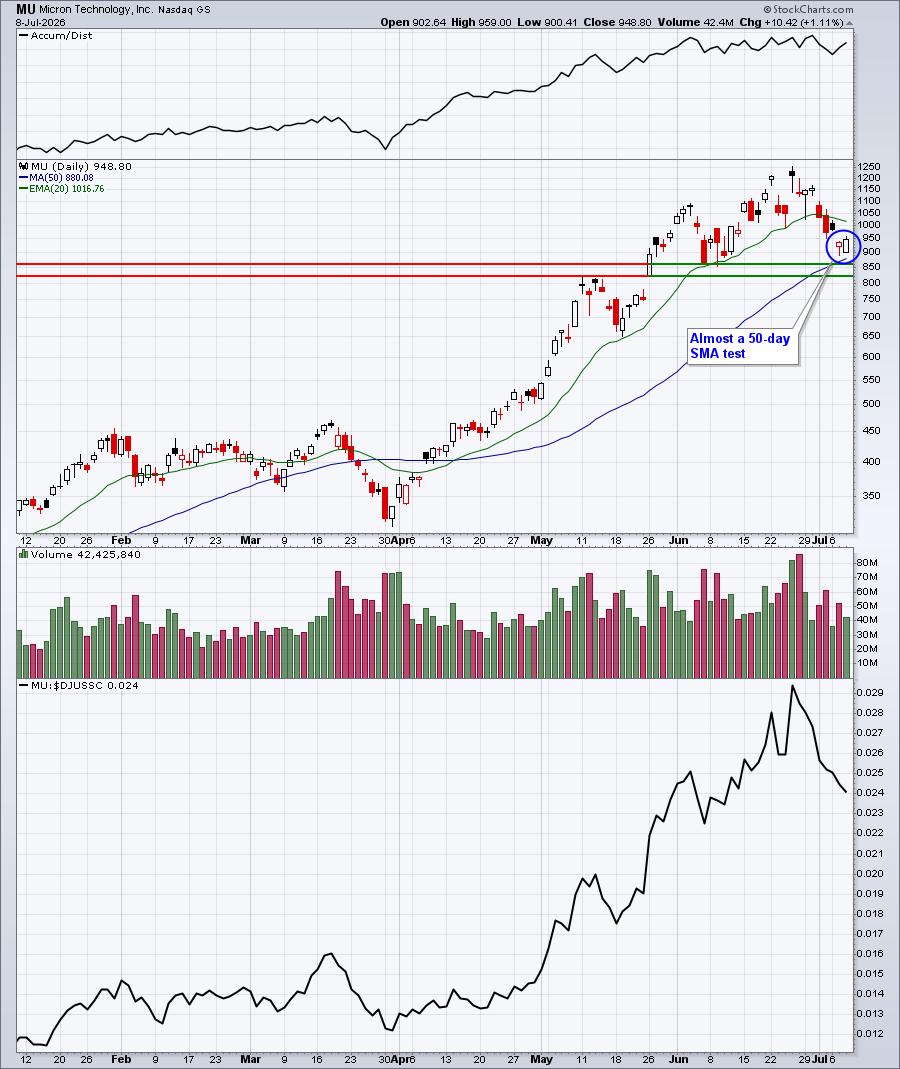
ICHR and MU appear to be two of the strongest semiconductor stocks and I've taken small positions in both, looking to add if they run into more short-term difficulty and head closer to their rising 20-week EMAs. But I am not providing a recommendation to buy anything. Rather, I'm simply explaining my rationale in taking positions. Also, I am a fairly aggressive trader, willing to take on significant risks.
I am NOT a Registered Investment Advisor and am not advising anyone to buy or sell any securities. Always make sure you consult with your own financial advisor before buying or selling any securities. EarningsBeats.com provides educational materials and information and our members decide, on their own, whether a position will be taken.
Upcoming Earnings
Our Upcoming Earnings ChartLists and Upcoming Earnings Relative Strength ChartList will be provided again, starting next week, as the large money-center banks kick off Q2 earnings season.
Economic Reports
FOMC minutes released at 2:00pm ET
Happy trading!
Tom