
EB Daily Market Report - Tuesday, July 14, 2026
Upcoming Schedule and Events
Tomorrow morning, I will be traveling out of town for an annual golf trip. For the most part, it'll be business as usual. I'll have my computers with me and my schedule is such that I can work some on both Thursday and Friday. However, there will be 2 parts of our service impacted.
First, I will be traveling early tomorrow morning, so tomorrow's Live Trading Room is cancelled. I won't likely be back home until late Sunday evening, so it's unlikely that we'll have a Weekly Market Recap video on YouTube this weekend. Otherwise, unless specifically mentioned during upcoming days, everything else should be "business as usual."
Max Pain
Later today, at 5pm ET, we'll host our July Max Pain webinar to take a look at where options stand as we head into options-expiration Friday. We will send out room instructions separately.
Model ETF Portfolio Draft
It's hard to believe, but three months has already passed since our last Model ETF Portfolio draft. We've had a solid quarter with the Model ETF Portfolio outperforming the S&P 500 by 2 1/2 percentage points through last Friday's close. Ordinarily, we'd hold the draft later this week and plan to enter positions as of Friday's close. However, we're going to wait to hold the draft on Monday evening, July 20th, as the Monday that follows options-expiration Friday has historically been the worst day of the calendar month to be invested. Those Mondays have risen just 37% of the time since 1950, so the odds favor waiting until after Monday's close to enter. We'll discuss the timing of our entry on Monday evening, but it'll likely be at the opening prices on Tuesday.
So we will EXIT all current positions in our Model ETF Portfolio as of Friday's close and our Model ETF Portfolio will be in CASH on Monday.
Executive Summary
- Futures were mostly lower overnight, but got a boost from a surprisingly-tame June CPI report
- Our major indices are mostly higher on the session, although the Dow Jones ($INDU, -0.16%) is weighed down by IBM, which has fallen nearly 25% after pre-announcing disappointing results
- Semiconductors ($DJUSSC, +3.33%) have rebounded sharply, helping to lead technology (XLK, +1.41%) higher
- Defensive areas like health care (XLV, -1.95%) and consumer staples (XLP, -1.22%) are underperforming today
- Crude oil ($WTIC, +1.31%) is up, though well off its earlier high today
- Other commodities are higher as well, led by silver ($SILVER, +1.99%) and gold ($GOLD, +1.56%)
- Lower-than-expected June CPI saw buyers flock into treasuries, sending the 10-year treasury yield ($TNX) down 8 basis points initially; it's since rebounded to 4.58%, down just 3 basis points
- Cryptocurrencies are jumping on the session as bitcoin ($BTCUSD, +4.30%) rallies to near 65000; most other cryptos are up in the 3-6% range
- Banks ($DJUSBK, +0.20%) are up fractionally as earnings season gets underway; JP Morgan (JPM, +1.71%) set a new all-time high after reporting better-than-expected EPS
- Goldman Sachs (GS, +7.69%) also posted excellent results and is trading at an all-time high
Market Outlook
Large cap growth (IWF) is typically a driver of secular bull market advances, but there's a heavy concentration of Mag 7 stocks in the IWF. Unfortunately, most Mag 7 stocks have been underperforming the S&P 500. Below is a chart showing the relative weakness of large cap growth vs. large cap value (IWF:IWD). Also highlighted on this chart is the relative performance of the Mag 7 (MAGS) vs. the S&P 500:
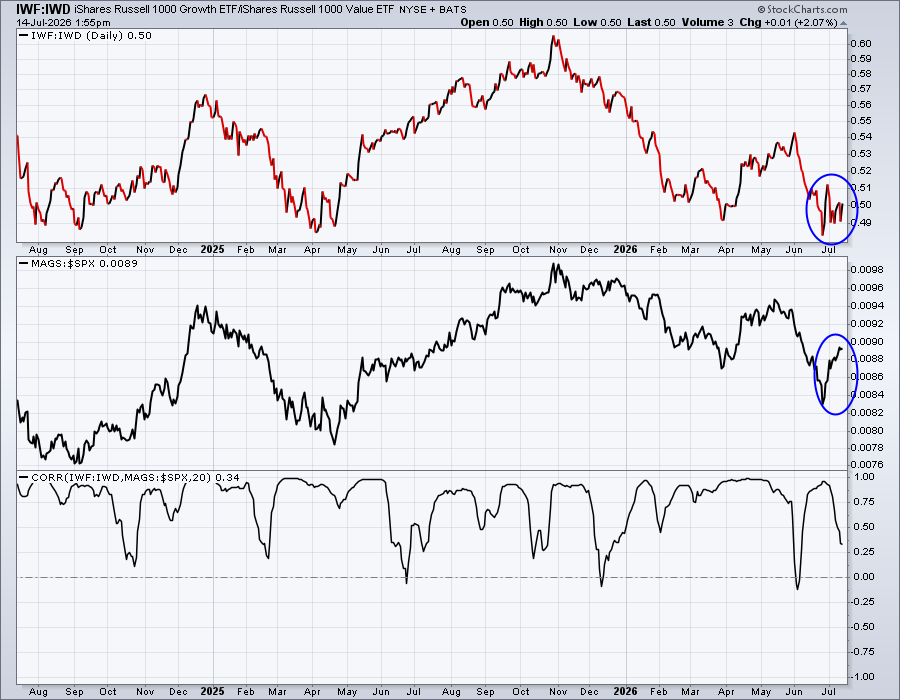
The relative charts look nearly identical, highlighting the importance of Mag 7 stocks in the growth vs. value (IWF:IWD) assessment that I routinely review. I did circle the recent relative performance of both, because it appears that the Mag 7 stocks have begun to show more relative strength, but that hasn't translated into much relative strength in large cap growth. The reason? Current consolidation in semiconductors is taking a short-term toll, in my opinion. I don't believe it lasts, though, as I stated last week, it's still quite possible that the stock market weakens further to test rising 20-week EMAs. I would include semiconductors among the areas that could still see this 20-week EMA test. I'm not expecting it, but I do acknowledge the possibility is still there.
Sectors/Industries
When we bottomed in late March, we went on a tear over the next two weeks with most aggressive areas fully supporting the move. Since then, however, both the XLY:XLP and IWF:IWD ratios have struggled. To be fair, the IWF:IWD ratio did set a new high over the next 5-6 weeks, but not by a lot. Meanwhile, that mid-April high on the XLY:XLP has not been penetrated.
So......I thought to myself, "What groups have been leading over the past three months, since mid April? Well, I've set the "Summary" page of the Industry Group Relative Strength ChartList to 3 months, highlighting the best-performing industry groups since that time. But first let's look at the Sector Summary over this same 3-month period:
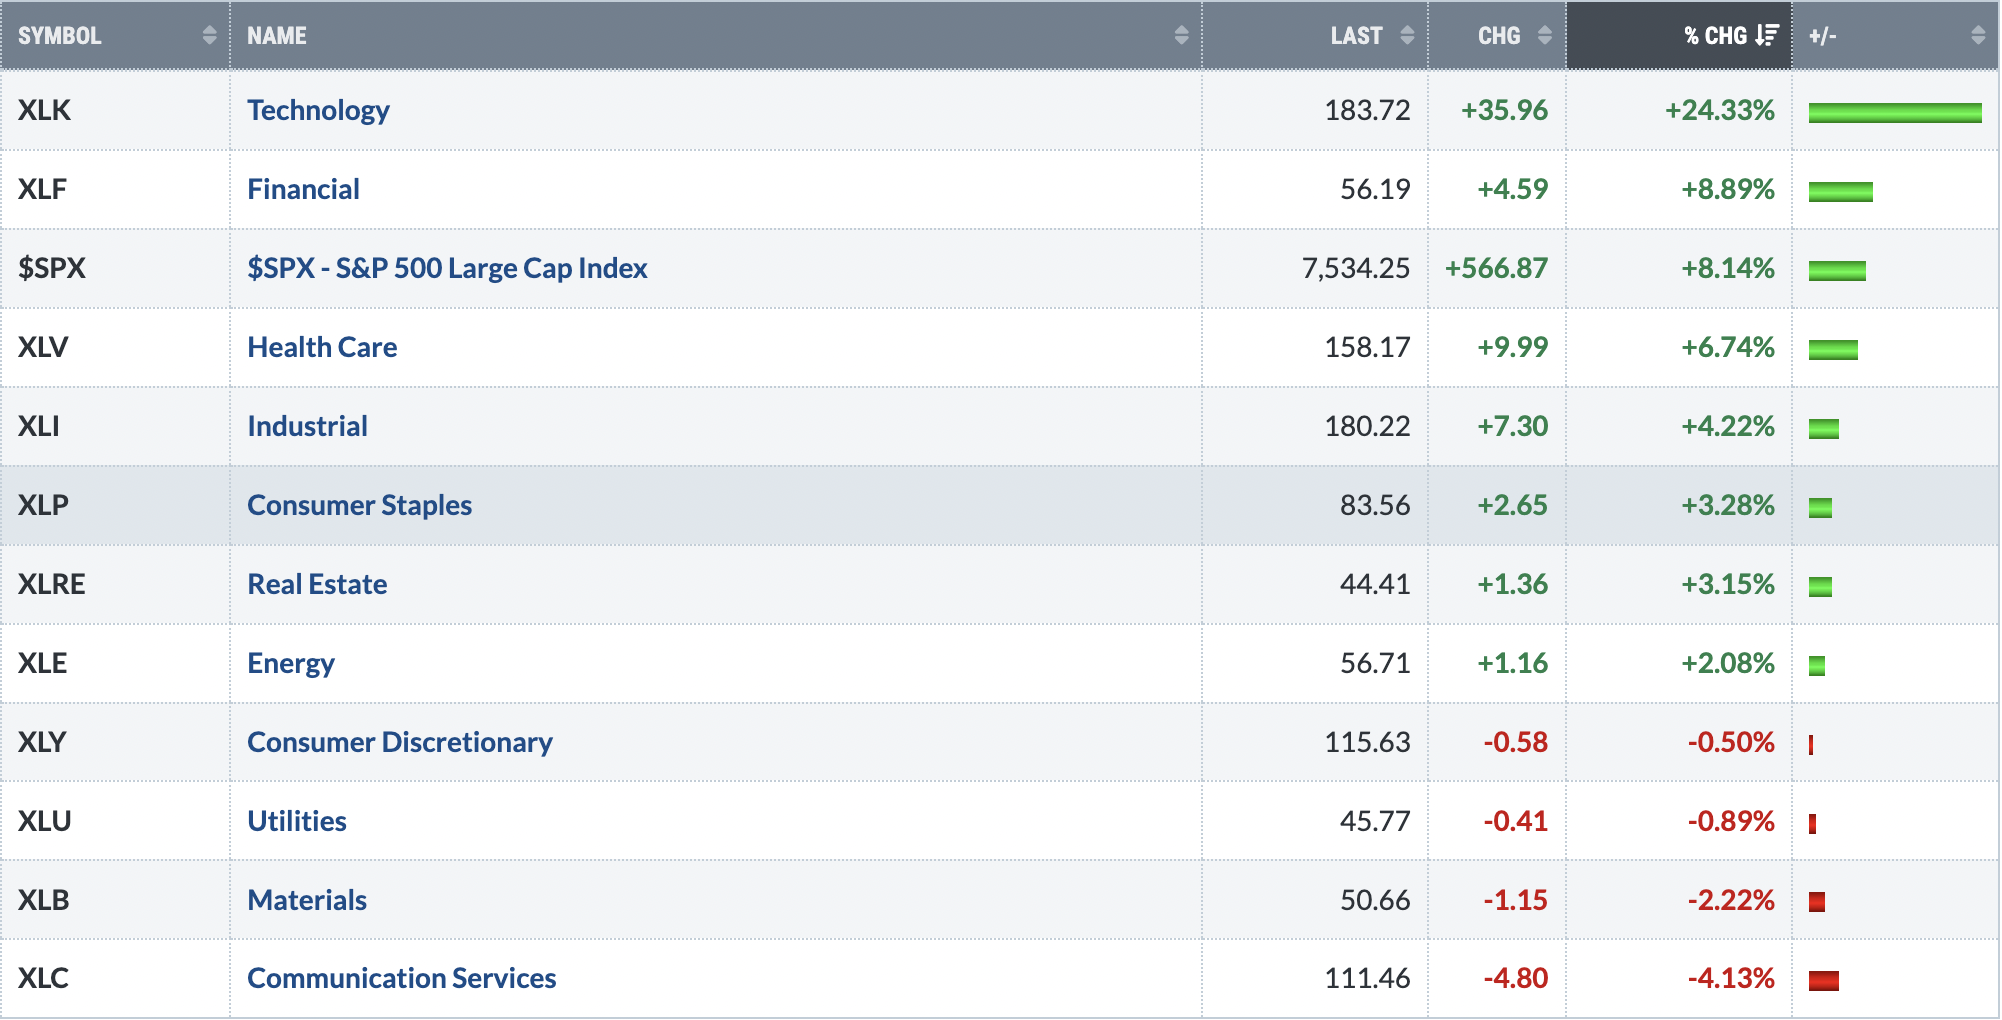
It's really hard to argue that Wall Street is setting up for a big drop ahead when technology (XLK) has been a clear and huge leader over the past 3 months.
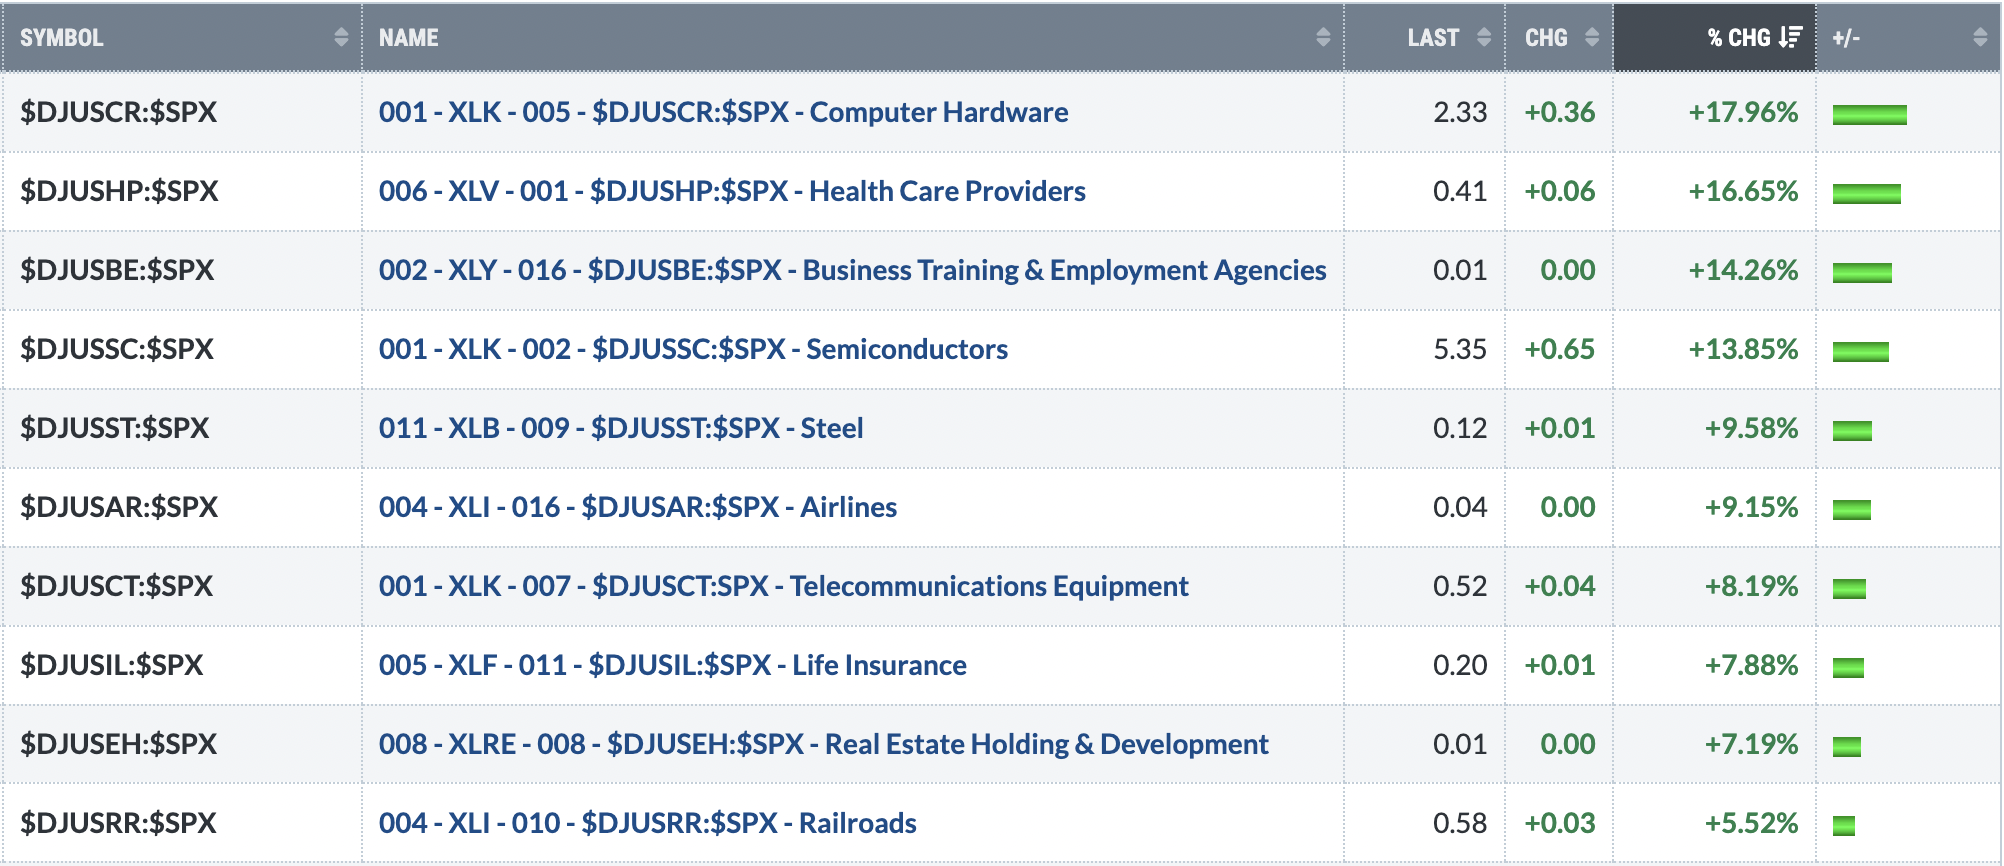
Furthermore, of the top 10 industry groups over the past 3 months, only 2 belong to defensive groups. 7 belong to the five aggressive sectors (XLK, XLY, XLC, XLI, XLF) and 1 is from materials (XLB). Again, I view this as supporting the current secular bull market.
So while the XLY:XLP and IWF:IWD ratios are worthy of caution, I really don't see much to support growing overly bearish at this time. Yes, we have the upcoming cautious summer months to consider, but I would be shocked to see much downside. Rising 20-week EMA tests is what I believe to be the worst-case short-term scenario.
ChartLists and Trading Strategies
One stock that I've built a position in is D-Wave Quantum, Inc. (QBTS). Let me first say that this is a very aggressive position and QBTS can be extremely volatile. It's certainly not for everyone. I'll explain what I like and each member can decide if it's something they might want to pursue.
First, let's look at the AD line on the daily chart. QBTS has been on the past two Strong AD ChartLists, despite its price action struggling. Here's that daily chart:
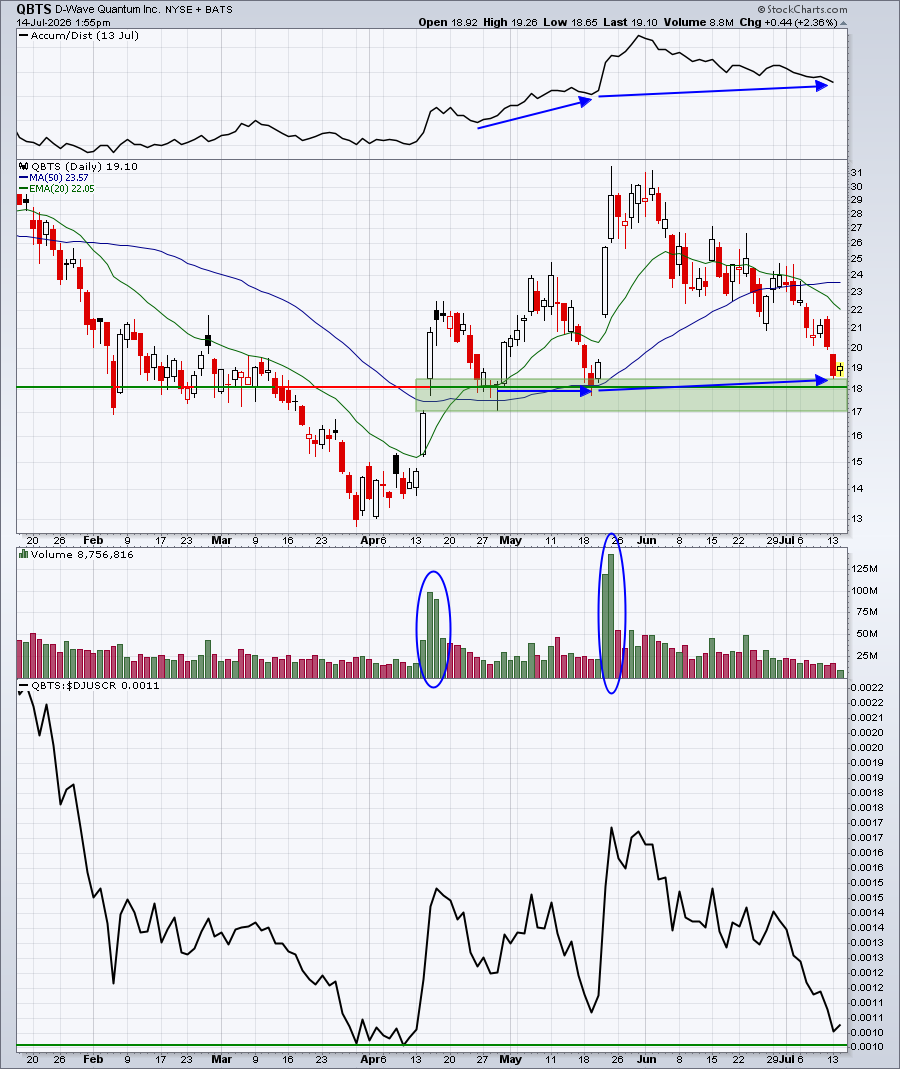
The AD line has been falling, but the overall trend still seems to be higher to me. It's clear that when there's volume in this stock, it tends to scream, "ACCUMULATION". The latest downtrend has been accompanied by much lighter volume. Still, this chart probably wouldn't be enough for me to consider entering. It was the longer-term weekly chart that got my attention:
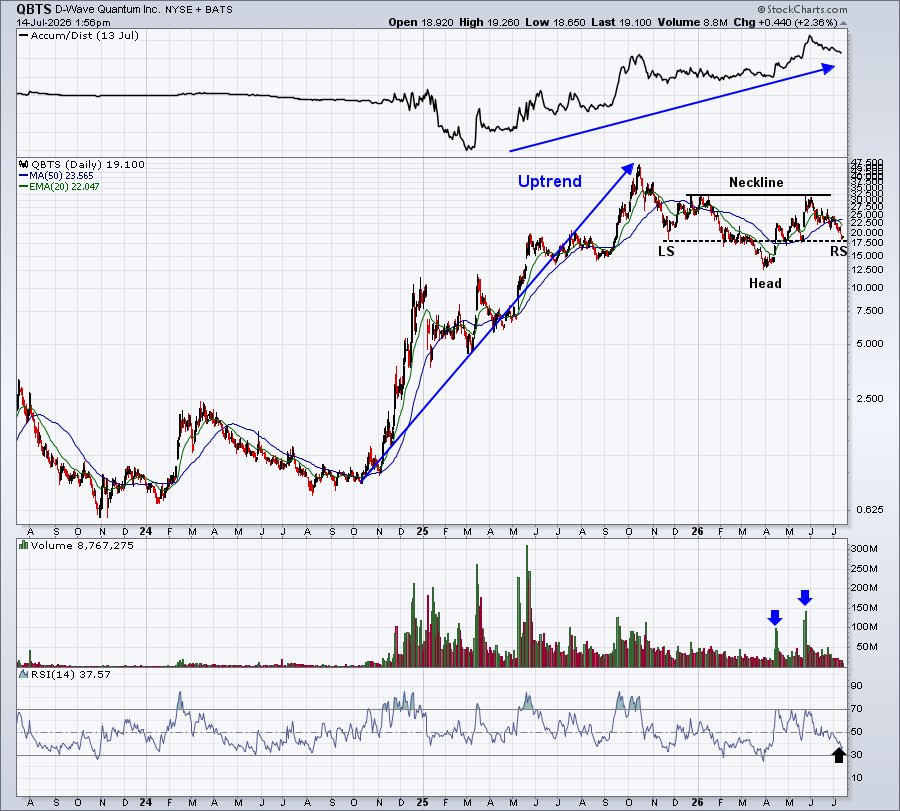
Off of an extended uptrend, I see a bullish inverse head & shoulders continuation pattern. We are potentially establishing an inverse right shoulder now, which is a very aggressive entry level. You can decide how much downside you're willing to risk, while at the same time realizing that, if this pattern plays out, a target price near 50 is the measurement on a neckline breakout above 32.
Upcoming Earnings
Upcoming Earnings and Upcoming Earnings Relative Strength ChartLists are now available on our website and we'll continue to track upcoming earnings reports and provide them to you via ChartLists throughout Q2 earnings season.
Economic Reports
June CPI: -0.4% (actual) vs. -0.2% (estimate)
June Core CPI: +0.0% (actual) vs. +0.2% (estimate)
Happy trading!
Tom